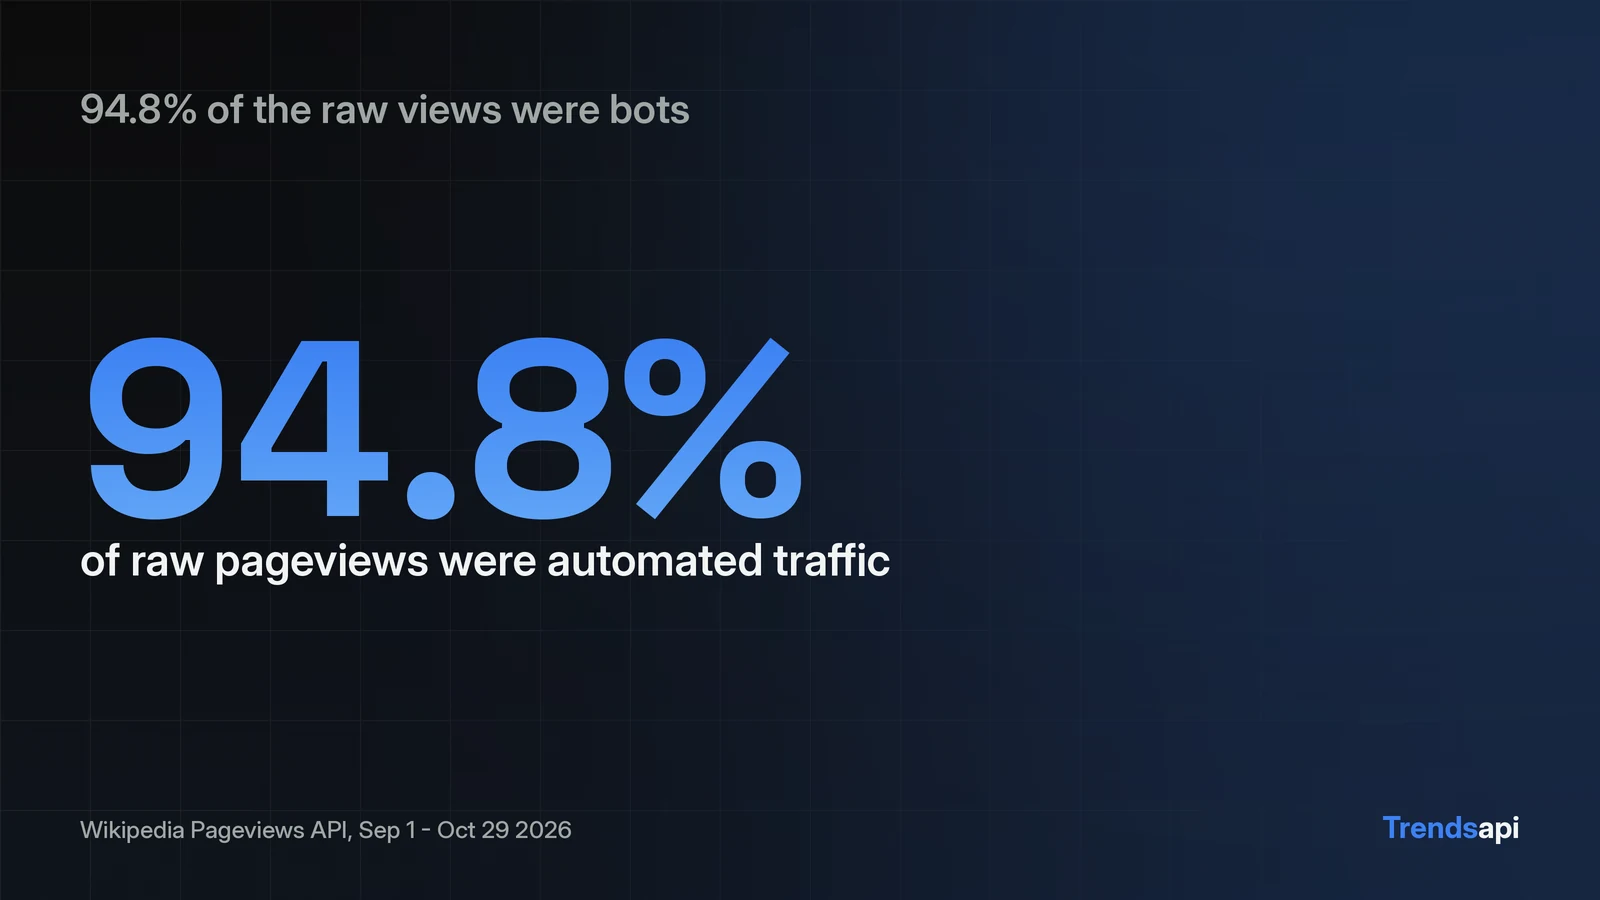
The Wikipedia Pageviews API returns daily or monthly view counts for any article, no key required. One GET request to https://wikimedia.org/api/rest_v1/metrics/pageviews/per-article/{project}/{access}/{agent}/{article}/{granularity}/{start}/{end} returns JSON with a timestamp and a view count per day. The call below ran live on November 1, 2026 against Python_(programming_language) for September 1 to October 29 and returned 59 daily points. The catch worth knowing first: with the default all-agents setting, 94.8% of the returned views were automated traffic, and one September day reported 1,283,135 views that no human spike explains. Filter to agent=user before trusting a number.
The one call you need
import requests

def pageviews(article, start, end, project="en.wikipedia", agent="user"):
    url = (
        "https://wikimedia.org/api/rest_v1/metrics/pageviews/per-article/"
        f"{project}/all-access/{agent}/{article}/daily/{start}/{end}"
    )
    r = requests.get(
        url,
        headers={"User-Agent": "trend-research/0.1 ([email protected])"},
        timeout=30,
    )
    r.raise_for_status()
    return [(i["timestamp"][:8], i["views"]) for i in r.json()["items"]]

rows = pageviews("Python_(programming_language)", "20260901", "20261029")
print(rows[0], rows[-1])
# ('20260901', 3111) ('20261029', 3850)
The pieces of the URL: project is the wiki (en.wikipedia), access is all-access, desktop, mobile-app or mobile-web, agent is all-agents, user, spider or automated, granularity is daily or monthly, and dates are YYYYMMDD. Copy the article title exactly as it appears in the URL bar, with spaces swapped for the _ character. The snippet above is the whole client; there is no SDK to install and no token to manage. The full parameter list is in the Wikimedia Pageviews API reference.
What the response looks like
Each item carries the project, article, granularity, a timestamp, the access and agent dimensions, and the count:
{
  "project": "en.wikipedia",
  "article": "Python_(programming_language)",
  "granularity": "daily",
  "timestamp": "2026102900",
  "access": "all-access",
  "agent": "user",
  "views": 3850
}
Two fields deserve attention. The timestamp ends in 00 because daily granularity aggregates to the day; hourly data is a different endpoint. The agent field echoes the filter you asked for, which makes it easy to spot when a wrapper library silently switched it. Note the response body arrives as a JSON string to parse again when you call through an HTTP client that does not decode it for you.
Filter to human traffic before you trust a number
The same query with agent=all-agents returned 5,681,230 views over the 59 days, a daily average of 96,292. Switching to agent=user returned 294,802, a daily average of 4,997. The bot share was 94.8%, and the all-agents series peaked at 1,283,135 on September 6, decaying over the following week. That decay reads as automated traffic rather than a news event, but that is a reading of the shape, not a confirmed cause.
The user-only series is the one that behaves like attention. Its median is 4,704 a day, its minimum 3,111, its maximum 27,546 on October 23. Set agent=user as your default and only widen to all-agents when you are specifically studying crawler behavior.
From daily views to a trend signal
Daily counts are noisy. A seven-day rolling average and a first-week to last-week comparison turn them into a signal:
import statistics

_, views = zip(*rows)
avg7 = [round(statistics.mean(views[i:i+7])) for i in range(len(views) - 6)]
first7 = round(statistics.mean(views[:7]))
last7 = round(statistics.mean(views[-7:]))
print(first7, last7, f"{100 * (last7 / first7 - 1):.1f}%")
# 4125 8198 98.7%
Human pageviews for the Python article roughly doubled over the window, from a first-week average of 4,125 a day to 8,198. One October 23 spike of 27,546 sits in the last week; dropping it leaves a last-week average of about 4,973 against 4,125 in the first week, still a clear upward slope. For a normalized view, divide each day by the window maximum and multiply by 100, which makes the series directly comparable to search-interest indexes.
Pageviews and search interest measure different things
Over the same window, Google Search interest for "Python programming" fell from a weekly index of 46 (week of September 5) to 12 (week of October 31), with a window range of 12 to 54. Pageviews doubled while search interest fell. The two are not contradictory: search captures curiosity and discovery, pageviews capture reference visits from people who already know the topic. This suggests pageviews work better as a proxy for active practitioners, search interest for new entrants, though confirming that reading needs more articles than one.
When you need search interest alongside pageviews across many platforms, a normalized trend feed saves rebuilding this plumbing per source. Its response body is a JSON string, so parse it once more after the first decode. The docs describe the endpoint and its free quota; see pricing for the limits that apply at scale.
Compare articles without re-running the client
The same function compares topics head to head:
def compare(articles, start, end):
    table = {}
    for a in articles:
        _, views = zip(*pageviews(a, start, end))
        table[a] = round(sum(views) / len(views))
    return sorted(table.items(), key=lambda kv: kv[1], reverse=True)

for article, daily_avg in compare(
    ["Python_(programming_language)", "JavaScript", "Rust_(programming_language)"],
    "20260901", "20261029",
):
    print(article, daily_avg)
Each call is independent, so the loop stays simple and the results sort themselves. Compare shapes, not raw counts: divide each series by its own maximum first, which puts every article on a 0-100 scale and shows which topic is accelerating regardless of size. One caveat: a single call returns a few thousand points at most, so very long windows at daily granularity need splitting into date ranges; monthly granularity sidesteps it.
Limits worth knowing
Data lags about two days: the latest day available on November 1 was October 29. Article renames break continuity, since the endpoint is keyed on the title; redirects are counted on the target article, which can quietly merge traffic you meant to keep separate. The user filter excludes spiders and automated traffic; Wikimedia reclassifies agents over time, so re-run old queries rather than trusting a cached series. The access breakdown (desktop, mobile-web, mobile-app) is worth pulling once per topic: it shows where readers come from, and mobile-heavy topics trend noisier. None of this is in the error messages; it is in the numbers, which is why the first query you write should always be a sanity check against all-agents.
FAQ
Does the API need a key?
No. Every call in this tutorial ran with no authentication. Send a descriptive User-Agent header; it is requested, not enforced.
How fresh is the data? About two days behind. On November 1, 2026 the newest available day was October 29.
Can I get hourly or per-country data? This endpoint offers daily and monthly granularity only, with project, access and agent breakdowns. Per-country data lives in a separate Pageviews API endpoint.