"Spotify API" draws 27,100 searches a month with low competition, and the searchers usually want chart data: what is rising, and how fast. The official Spotify Web API is a poor fit for that job. Its podcast endpoints return show and episode metadata, never a chart, and every call starts with OAuth: register an app, take credentials, trade them for a token. The same job is one POST to the Trends API. That call returns today's top 10 Spotify podcasts; add sort=rank_change and it returns the week's biggest movers. This tutorial ran both calls on November 2, 2026. The board had The Joe Rogan Experience at number 1, and The Watch climbing 94 ranks in seven days, the largest move of the week. The code below runs as written with the requests library and one environment variable.
One POST returns today's top 10
A single POST with mode get_top_trends and type "Spotify Top Podcasts" returns the current board.
import json
import os

import requests

API_URL = "https://api.trendsmcp.ai/api"
HEADERS = {
    "Authorization": f"Bearer {os.environ['TRENDS_API_KEY']}",  # free key from your trendsapi.ai account page
    "Content-Type": "application/json",
}


def trends(payload):
    res = requests.post(API_URL, json=payload, headers=HEADERS, timeout=30)
    res.raise_for_status()
    envelope = res.json()
    return json.loads(envelope["body"])


top10 = trends({
    "mode": "get_top_trends",
    "type": "Spotify Top Podcasts",
    "limit": 10,
})

for rank, name in top10["rows"]:
    print(rank, name)
Running this on November 2, 2026 returned a board stamped 2026-11-02 09:01 UTC:
| Rank | Podcast |
|---|---|
| 1 | The Joe Rogan Experience |
| 2 | Good Hang with Amy Poehler |
| 3 | The Shawn Ryan Show |
| 4 | This Past Weekend w/ Theo Von |
| 5 | Crime Junkie |
| 6 | The Daily |
| 7 | The Diary Of A CEO with Steven Bartlett |
| 8 | The Tucker Carlson Show |
| 9 | Matt and Shane's Secret Podcast |
| 10 | Up First from NPR |
The parameter names are documented on the get-top-trends reference. The same endpoint covers 53 platforms, so the call shape stays identical when the question moves to another chart.
The stamp matters. Every response carries an as-of time, and the ranks are a snapshot, not a stream. Re-running the same call later returns a fresh snapshot; nothing in the request changes between calls. For pipelines that diff snapshots, store the as-of value alongside the rows, then compare rank positions across days instead of assuming the board only moves forward.
sort=rank_change finds the week's biggest movers
Two more parameters turn the snapshot into a momentum query. sort=rank_change with window=7d ranks each show by how far it climbed this week.
movers = trends({
    "mode": "get_top_trends",
    "type": "Spotify Top Podcasts",
    "sort": "rank_change",
    "window": "7d",
    "limit": 10,
})

for row in movers["rows"]:
    print(row["keyword"], "rose", row["rank_change"], "ranks to", row["rank"])
| Rank | Podcast | 7-day change |
|---|---|---|
| 64 | The Watch | +94 |
| 89 | Restricted Radio | +90 |
| 23 | STAN:A | +84 |
| 36 | Black Yoga Room | +74 |
| 54 | Rehab Science: Move Better | +71 |
| 122 | TRIGGERnometry | +49 |
| 53 | Just Creepy: Scary Stories | +42 |
| 159 | Real Baron Podcast | +41 |
| 107 | Mystery Boys w/ Kurt Metzger & Duncan Trussell | +34 |
| 112 | Whiskey Ginger with Andrew Santino | +28 |
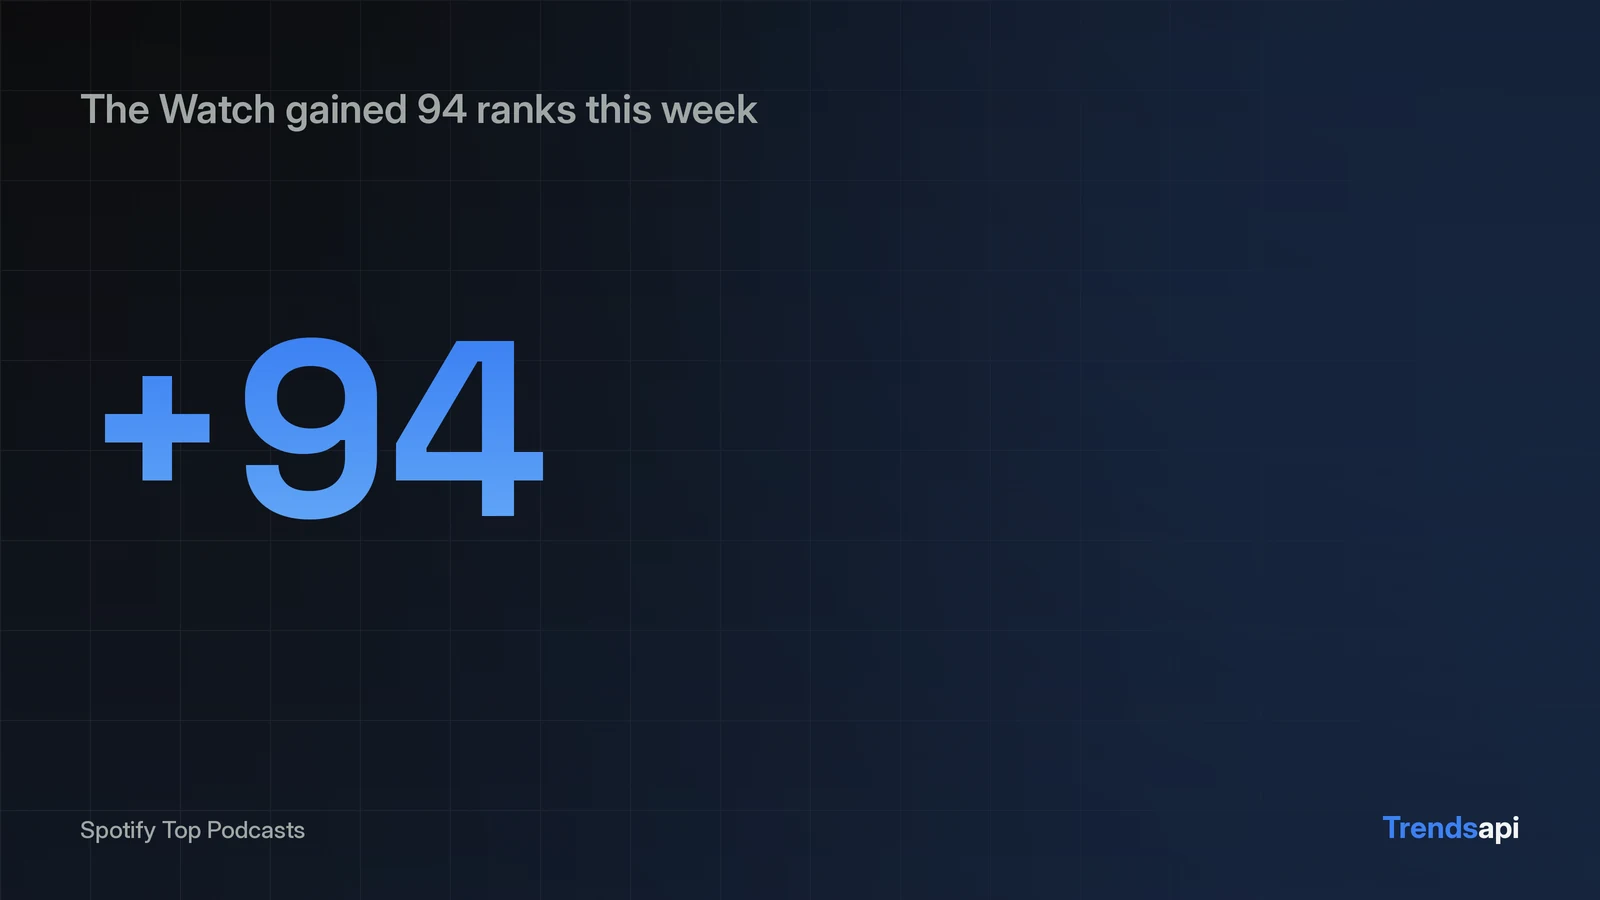
The Watch gained 94 ranks in seven days, the week's largest climb on the board. Restricted Radio rose 90, and STAN:A rose 84 to reach rank 23. One mover came from rank 200, so the underlying board reaches at least 200 positions.
The window parameter sets the comparison span. This run used 7d, so every rank_change measures movement since the previous week's board. Sorting only reorders. This suggests the sorted rows come from the same board, which is why prev_rank is available for the arithmetic.
The envelope parses twice
The REST endpoint always answers HTTP 200 with an envelope, {"statusCode": 200, "body": ...}, and body is itself a JSON string. The response parses twice: res.json() opens the envelope, json.loads() opens the payload. Skip the second parse and the chart data stays trapped inside a string. The trends() helper above handles this, so the rest of the code works on plain dicts and lists.
The two calls return different row shapes
Watch the rows. The plain call returns [rank, name] pairs, so a direct tuple unpack works. The sorted call returns dicts with rank, keyword, prev_rank and rank_change. The shape was verified live in this run:
print(top10["rows"][0])   # [1, 'The Joe Rogan Experience']
print(movers["rows"][0])  # {'rank': 64, 'keyword': 'The Watch', 'prev_rank': 158, 'rank_change': 94}
Dicts carry the previous rank, which pairs do not. When one loop handles both calls, check the row type first: a list unpacks, a dict reads by key.
Put the board on a schedule
Chart data compounds when it is diffed over time. A single snapshot answers what is rising this week. A pipeline that re-runs the movers call daily and stores the rows can flag when a show's climb accelerates, by comparing each keyword's rank_change across snapshots. The request never changes; only the stored history grows. The live Spotify board already carries the daily snapshot for readers who just want to look.
What a rank move proves, and what it does not
Ranks are board positions, not listener counts. A +94 move means a show passed 94 others; it says nothing about absolute audience size. The as-of stamp tells when the snapshot was taken, and ranks can shift between snapshots. A climb is a signal to investigate, not proof of a cause: this run verified what moved, not why. One honest caveat on the movers query: window=7d compares this week to last, so a new entry near the bottom can post a large gain without new listeners.
Questions readers ask
Do I need a Spotify app, OAuth credentials, or a token for this?
No. The call above authenticates with one API key sent as a Bearer token. The official Spotify Web API starts with OAuth after app registration, and its podcast endpoints cover shows, episodes and libraries, not charts (see Spotify's podcast API announcement). The free key comes from the trendsapi.ai account page; quota details sit on /pricing.
How far do 100 free requests go?
Two calls a day, the top-10 snapshot plus the movers query, uses about 60 requests a month, inside the 100 free requests.
Which charts exist beyond podcasts?
The same mode serves 53 platforms, from music charts to app stores. The podcast landing page covers podcast data specifically, and a similar walkthrough for Wikipedia pageviews lives at /blog/wikipedia-pageviews-api. Swap the type parameter, keep the envelope parsing, and the loop stays the same.