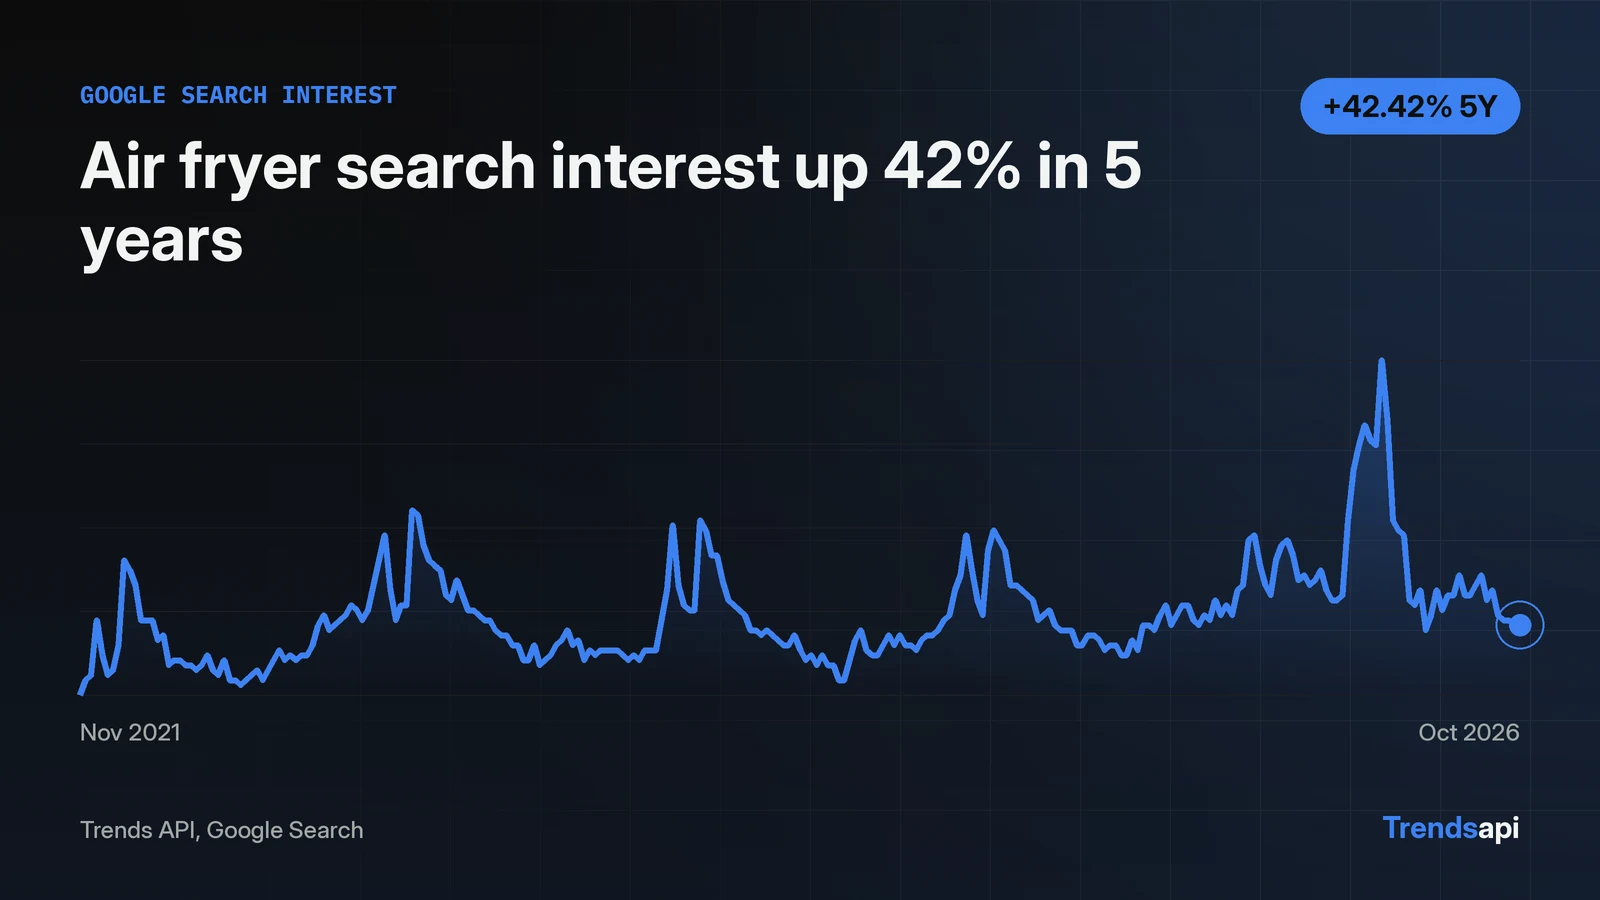
A 5 year backfill of Google Search interest takes one Trends API call. get_time_series with keyword air fryer and source Google Search returned 261 weekly points, from 2021-11-06 to 2026-10-31, for 1 request. The first point scored 33. The last scored 47. Growth over the full window was +42.42 percent. The peak hit 100 on 2026-05-09. This tutorial shows the exact POST body, how to read the response, how to slice the series into windows in Python, and how to store all 261 rows in SQLite with a primary key on keyword, source, and date. The code runs as written with a free API key.
One call returns 261 weeks, with no paging loop
get_time_series returns the full history in a single response. There is no page token to follow and no second call to fetch older weeks. The response is a list of points, oldest first, each with a date, a 0 to 100 value, and a volume where the source has one. For air fryer on Google Search the call returned 261 points covering 2021-11-06 to 2026-10-31. That is about 5 years of weekly history in 1 request. A keyword with no data returns a no_data error instead of an empty list, so a backfill script must handle that case. Daily resolution exists for Google sources, but it covers the last 90 days only. A 5 year backfill is weekly by design.
The request is one POST with three fields
The endpoint is https://api.trendsmcp.ai/api. The body sets mode to get_time_series, keyword to the phrase, and source to Google Search. Auth is a bearer token in the Authorization header. A free key comes from the Trends API account page with an email address and an 8 digit code, and no card is needed.
curl -X POST https://api.trendsmcp.ai/api \
  -H "Authorization: Bearer YOUR_API_KEY" \
  -H "Content-Type: application/json" \
  -d '{"mode": "get_time_series", "keyword": "air fryer", "source": "Google Search"}'
The same call in Python:
import json

import requests

resp = requests.post(
    "https://api.trendsmcp.ai/api",
    headers={"Authorization": "Bearer YOUR_API_KEY"},
    json={"mode": "get_time_series", "keyword": "air fryer", "source": "Google Search"},
    timeout=30,
)
resp.raise_for_status()
envelope = resp.json()
if envelope.get("statusCode") != 200:
    raise SystemExit(f"API error: {envelope['body']}")
series = json.loads(envelope["body"])
The response body is a JSON string to parse again, so resp.json() alone gives an envelope with a string inside it, and json.loads on that string gives the list of points. That second parse is easy to miss: resp.json() alone returns an envelope, not the list. Each point then looks like {"date": "2021-11-06 00:00:00+00:00", "value": 33.0, "volume": 2476514, "keyword": "air fryer", "source": "google search"}. The Python setup for the Google Trends API covers key handling and the client options in more detail, and the API docs list every source and option.
Slice the series in Python instead of calling again
The backfill lands once. Every window after that is a slice of the list already in memory. Yearly means for air fryer come from grouping the 261 points by year, with no extra request. The 2021 mean of 39.1 covers 8 weeks only, since the series starts in November. The full-year means run 45.2 in 2022, 47.6 in 2023, 46.8 in 2024, 50.1 in 2025, and 59.8 across the 44 weeks of 2026 returned so far.
from collections import defaultdict
import statistics

by_year = defaultdict(list)
for point in series:
    by_year[point["date"][:4]].append(point["value"])

for year in sorted(by_year):
    print(year, len(by_year[year]), round(statistics.mean(by_year[year]), 1))
Growth windows come from get_growth, which takes several windows in one call for 1 request. The call below asked for 3M, 12M, and 5Y in a single request, and the API answered all three.
resp = requests.post(
    "https://api.trendsmcp.ai/api",
    headers={"Authorization": "Bearer YOUR_API_KEY"},
    json={
        "mode": "get_growth",
        "keyword": "air fryer",
        "source": "Google Search",
        "percent_growth": ["3M", "12M", "5Y"],
    },
    timeout=30,
)
resp.raise_for_status()
envelope = resp.json()
if envelope.get("statusCode") != 200:
    raise SystemExit(f"API error: {envelope['body']}")
growth = json.loads(envelope["body"])
| Window | Baseline date | Baseline value | Recent date | Recent value | Growth |
|---|---|---|---|---|---|
| 3M | 2026-08-01 | 53.0 | 2026-10-31 | 47.0 | -11.32% |
| 12M | 2025-11-01 | 49.0 | 2026-10-31 | 47.0 | -4.08% |
| 5Y | 2021-11-06 | 33.0 | 2026-10-31 | 47.0 | +42.42% |
Point-to-point growth compares two single weeks, so one hot or cold week moves the number. The 5Y figure says interest sits 42.42 percent above its starting week. The 12M and 3M figures say the recent direction is down. Both statements are true at once. That split is why a backfill stores the whole series instead of only the growth percentages.
Store 261 rows in SQLite with the raw values kept
SQLite fits a backfill of this size. One table holds the series, with a primary key on keyword, source, and date so a repeat run overwrites rows instead of duplicating them. The volume column stays in the table. The API returns a volume where the source reports one, so store it as returned and cite it as volume.
import sqlite3

db = sqlite3.connect("search_interest.db")
db.execute(
    """
    CREATE TABLE IF NOT EXISTS search_interest (
      keyword TEXT,
      source TEXT,
      date TEXT,
      value REAL,
      volume INTEGER,
      PRIMARY KEY (keyword, source, date)
    )
    """
)
db.executemany(
    "INSERT OR REPLACE INTO search_interest VALUES (?, ?, ?, ?, ?)",
    [
        (p["keyword"], p["source"], p["date"][:10], p["value"], p["volume"])
        for p in series
    ],
)
db.commit()
print(db.execute("SELECT COUNT(*) FROM search_interest").fetchone()[0])
The script above inserted 261 rows. A second run inserts 261 rows again and the count stays 261, because INSERT OR REPLACE matches the primary key. The data catalog lists the other 13 time series sources that fit the same table, from YouTube search interest to npm downloads. A multisource Python example shows the same pattern with several sources in one script.
What the air fryer series shows after the backfill
Interest ended 42.42 percent above its starting week and peaked in spring 2026, with a dip in 2024 and a down turn in the last 3 months. The yearly means climb from 45.2 in 2022 to 59.8 in the 44 weeks of 2026 returned so far. The peak week scored 100 on 2026-05-09, with a volume of 7,504,587 attached to that point. Six weeks scored 80 or above, and all six fell between 2026-04-11 and 2026-05-16. The 2026 monthly means show the shape: January 60.2, April 83.0, May 81.0, then a fall to 47.8 in October. The last 4 weeks read 48, 48, 47, and 47, a flat tail after the spring peak.
The data shows when interest moved. It does not show why. Nothing in the series names a cause for the April and May 2026 peak, and this tutorial does not assign one. A next step is get_context for the peak weeks, which returns the posts and stories behind a keyword. Until that call runs, the peak is a date and a number, not an explanation.
Check the backfill before trusting it
Four checks catch the common failures. First, the row count must equal the point count: 261 rows stored against 261 points returned. Second, the stored dates must run 2021-11-06 to 2026-10-31 with 7 days between consecutive points. Third, no row may hold a null value or a value outside 0 to 100. Fourth, spot-check the extremes: the minimum is 33.0 on 2021-11-06 and the maximum is 100.0 on 2026-05-09. Any mismatch means the load step dropped or shifted a row, and the fix belongs in the load code, not in the stored data.
One honest note on demand: Keyword Planner reports 0 monthly searches for the exact phrase backfill search interest data. The piece answers a task developers search for in other words, not a high-volume query. The value here is the working code and the real series, not the keyword itself.
Backfill questions, answered
Does the API return 5 years for every keyword?
No. About 5 years is the span where the source has history. A newer keyword returns a shorter series, and the first date in the response says how far back the data reaches. The code above groups the points by the years present in the data instead of assuming a fixed range.
Can one backfill feed a dashboard?
Yes. The SQLite table above is enough for a small dashboard: one query per keyword returns the series, and a nightly get_time_series call refreshes it. Keep the primary key, keep the raw values, and compute means and growth at read time so the stored rows never go stale.