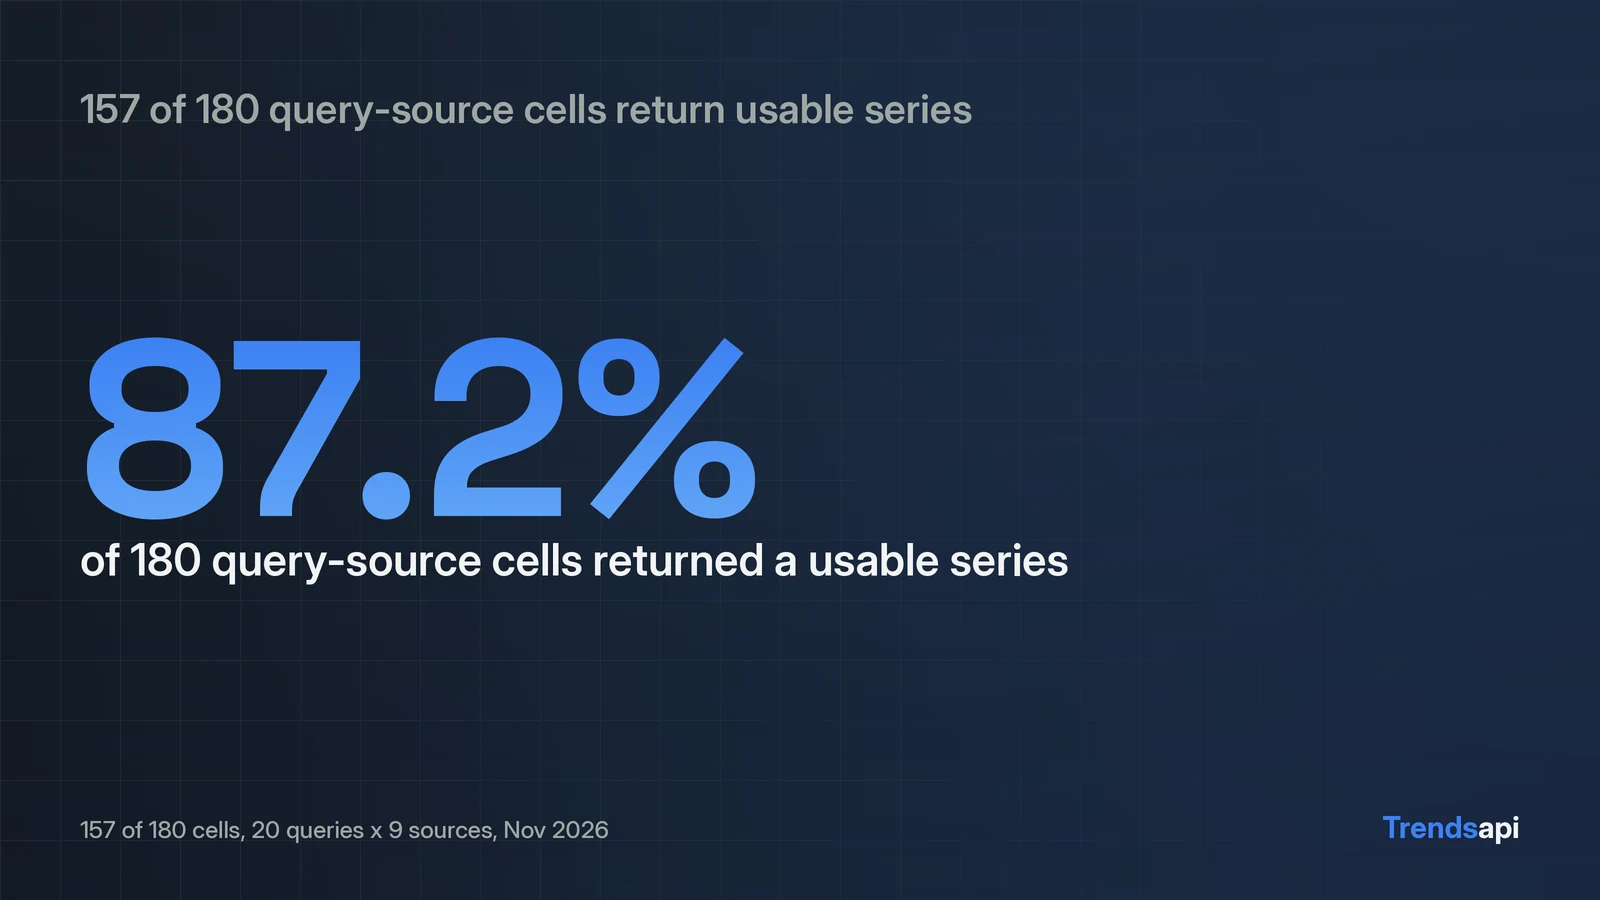
On November 3, 2026, this audit ran 185 get_time_series calls against the Trends API: 20 queries crossed with 9 sources, plus one keyword on each of 5 specialized datasets. A cell counted as usable when the call returned 5 or more points with a non-null value. Result: 157 of 180 grid cells were usable, which is 87.2% coverage. All 23 failures were no_data errors, and they clustered. The five Google-family sources returned a usable series for all 20 queries, while TikTok and Pinterest each covered only 12. News queries averaged 7.0 of 9 sources; shopping queries averaged 8.6. All five specialized datasets returned a usable series for a correctly formatted keyword. The pattern that works: probe first, then build.
Method: one call per cell, 5 points to count
Each of the 20 queries was sent to each of the 9 free-form sources with a single get_time_series call. A cell counted as usable only when the response held 5 or more points with a non-null value. That threshold rules out one-off blips and thin partial windows. The 20 queries covered four categories, five queries each:
| Category | Queries |
|---|---|
| Tech | iphone 18, nvidia, chatgpt, bitcoin, electric vehicles |
| Shopping | air fryer, stanley cup, lego, hyaluronic acid, dyson airwrap |
| Entertainment | taylor swift, gta 6, stranger things, minecraft, world cup 2026 |
| News | AI regulation, World Series, inflation, hurricane, election polls |
The 9 sources were Google Search, Google Images, Google News, Google Shopping, YouTube, Wikipedia, TikTok, Amazon, and Pinterest. The data catalog lists 14 keyword sources in total; the 9 above accept any name or phrase, while the other 5 require exact identifiers and were tested separately. Every dataset the API serves is listed in the data catalog.
The exact call for one cell:
curl -X POST https://api.trendsmcp.ai/api \
  -H "Authorization: Bearer YOUR_API_KEY" \
  -H "Content-Type: application/json" \
  -d '{"mode": "get_time_series", "keyword": "air fryer", "source": "Google Search"}'
And the parsing check in Python:
import json
import requests

resp = requests.post(
    "https://api.trendsmcp.ai/api",
    headers={"Authorization": "Bearer YOUR_API_KEY"},
    json={"mode": "get_time_series", "keyword": "air fryer", "source": "Google Search"},
).json()

# The response body is a JSON string: parse it again, then count usable points.
rows = json.loads(resp["body"])
usable = sum(1 for r in rows if r.get("value") is not None) >= 5
Every call used the default global scope and the default weekly resolution, so the point counts below reflect the API's standard output, not a tuned query. Calls that returned no_data were recorded as-is. The audit treated them as findings, not as prompts to retry with different phrasing.
Google-family sources covered all 20 queries
The five Google-family sources returned a usable series for every one of the 20 queries, at a median of 261 points per series. The window and the point density were uniform across all five, which is the coverage behavior a pipeline can rely on.
| Source | Usable (of 20) | Median points | Queries with raw volume |
|---|---|---|---|
| Google Search | 20 | 261 | 4 |
| Google Images | 20 | 261 | 0 |
| Google News | 20 | 261 | 0 |
| Google Shopping | 20 | 261 | 0 |
| YouTube | 20 | 261 | 0 |
The data shows uniform point density across the five sources, a median of 261 points each. That density matches a multi-year weekly cadence, the documented behavior for these sources in the data catalog. This suggests the Google-family feeds are the safest default when a pipeline needs one series per query with no fallback logic. One caveat: only Google Search carried raw volume, on 4 of the 20 queries. Volume is the exception here, not the rule. Google Shopping's perfect score deserves a note: all 20 queries returned a series there, including abstract news terms like inflation and election polls, where TikTok and Pinterest dropped out.
Where the gaps were: 60% on TikTok, 60% on Pinterest
TikTok and Pinterest were the thinnest sources, each returning a usable series for 12 of 20 queries. TikTok series were short, a median of 28 points, but every usable TikTok cell carried raw hashtag views, 12 of 12. Pinterest returned longer windows, a median of 105 points, with no volume on any query.
Wikipedia and Amazon sat between the two extremes. Wikipedia covered 17 of 20 queries at a median of 60 points, with raw views on all 17; its misses were likely queries with no matching article (iphone 18, dyson airwrap, election polls). Amazon covered 16 of 20 at a median of 51 points, with raw volume on all 16; it returned no_data for iphone 18, world cup 2026, AI regulation, and election polls.
All 23 failures in the grid were no_data errors, distributed as follows:
| Query | Source with no data |
|---|---|
| iphone 18 | Wikipedia, Amazon |
| nvidia | |
| chatgpt | TikTok, Pinterest |
| bitcoin | TikTok |
| electric vehicles | TikTok, Pinterest |
| stanley cup | TikTok |
| dyson airwrap | Wikipedia |
| gta 6 | TikTok |
| minecraft | |
| world cup 2026 | Amazon |
| AI regulation | TikTok, Amazon, Pinterest |
| World Series | |
| inflation | TikTok |
| hurricane | |
| election polls | Wikipedia, TikTok, Amazon, Pinterest |
The data shows the gaps cluster on tech and news queries. This suggests the hashtag and pin-search feeds cover culture and products first, and treat abstract news terms as out of scope.
News queries had the thinnest coverage
News was the lowest-scoring category, averaging 7.0 usable sources per query. Election polls was the weakest single query in the audit at 5 of 9, with no data from Wikipedia, TikTok, Amazon, or Pinterest. AI regulation followed at 6 of 9.
| Category | Mean usable sources (of 9) |
|---|---|
| Shopping | 8.6 |
| Entertainment | 8.4 |
| Tech | 7.4 |
| News | 7.0 |
Five queries cleared all 9 sources: air fryer, lego, hyaluronic acid, stranger things, and taylor swift. The data shows concrete products and franchises travel cleanly across sources. This suggests ambiguous news terms are the case to design fallbacks for.
The 5 specialized datasets all returned usable series
All five specialized datasets returned a usable series for a correctly formatted keyword. These sat outside the 20-query grid because they require exact identifiers.
| Dataset | Test keyword | Points | Raw volume |
|---|---|---|---|
| npm | react | 260 | yes |
| Python | pandas | 257 | yes |
| Steam | Elden Ring | 55 | yes |
| App Downloads | com.openai.chatgpt | 160 | yes |
| App Rankings | com.whatsapp | 23 | yes |
The identifier rules are strict: an exact npm package name, an exact PyPI project name, a game display title, or an Android bundle ID. The exact formats for each source are documented in the keyword format reference.
What the gaps mean for a data pipeline
A pipeline should probe each source with one get_time_series call before committing to a dashboard or model input. 23 of the 180 grid cells returned no_data, and every failure was that same explicit error: no timeouts, no schema surprises. Failed calls are free, so probing a dead cell costs nothing (plan details: pricing).
The probe-first pattern that falls out of the data: send one call per source, keep the sources with 5 or more points, and branch to a fallback wherever no_data comes back. Working multisource examples that already build this way are the collagen peptides multisource comparison and the portable coffee maker product research walkthrough.
One honest limit: this is a single snapshot from November 3, 2026 with default global scope. Country-scoped calls or a different Wikipedia language can behave differently, and a source that covered a query today is not guaranteed to cover it next month. Coverage maps go stale; re-probe on a schedule.