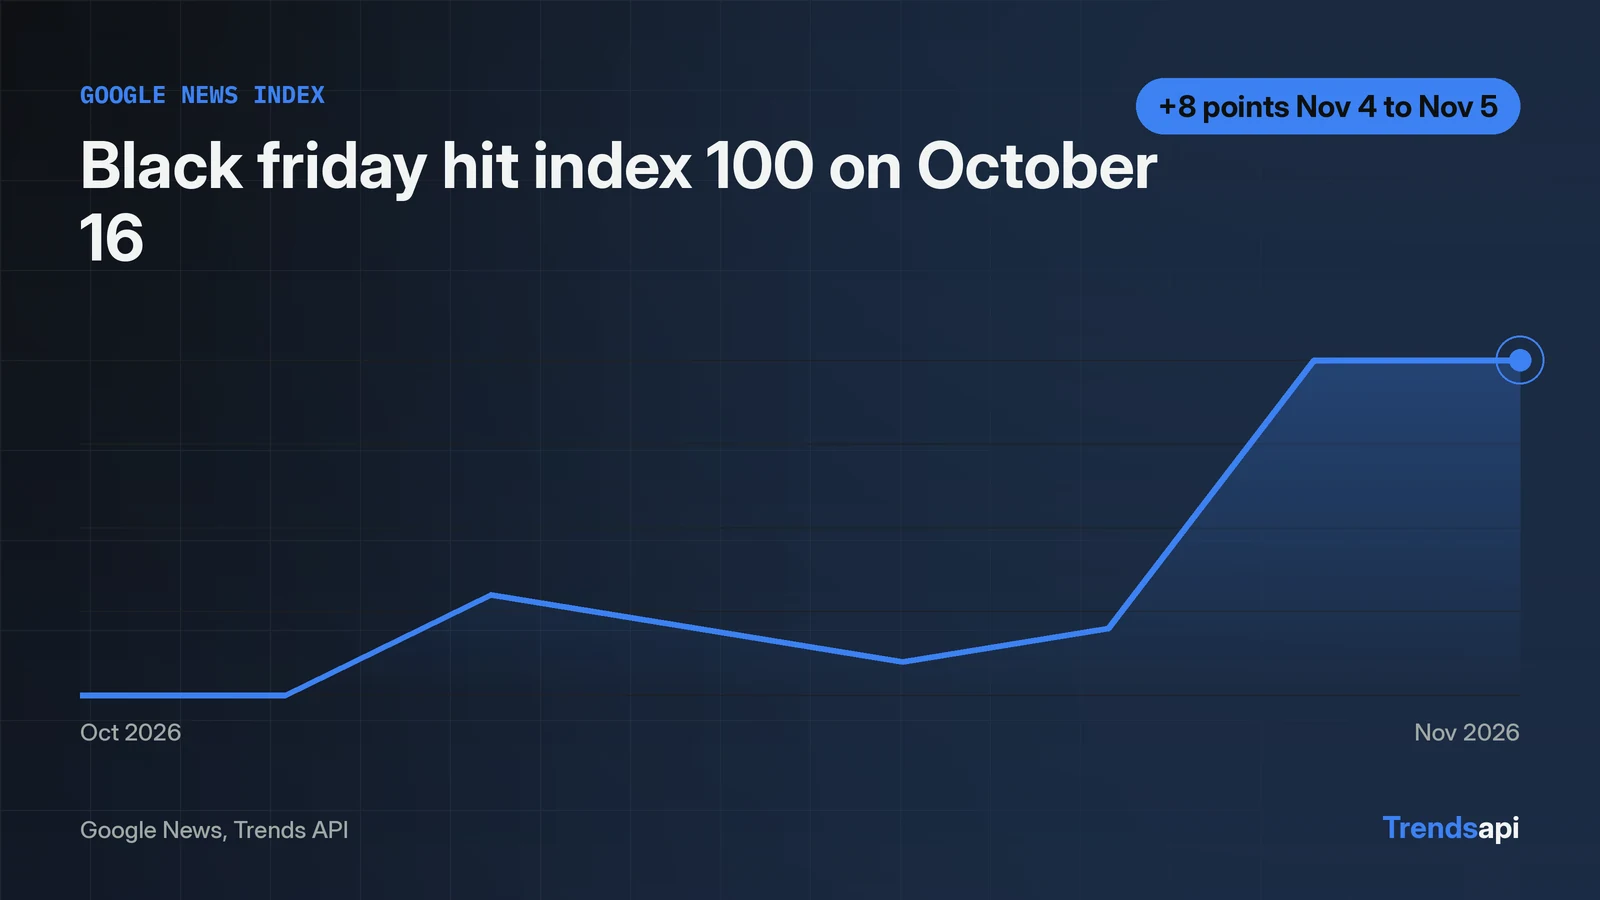
One POST to https://api.trendsmcp.ai/api returns Google News headlines and daily search interest as JSON. The call needs a Bearer key and a body with mode, plus type for a board or keyword and source for a series. Two calls cover this tutorial: get_top_trends with type Google News Top News and limit 10, and get_time_series with keyword black friday, source Google News, and resolution daily. On November 7, 2026, the board led with a Washington Post story on Stephen Miller's promotion, and the black friday series ran 92 daily points from August 7 to November 6, peaking at index 100 on October 16 and closing at 25. Each call costs 1 request over REST. The code below runs as written with only the key swapped.
Working code: headlines first, daily index second
Two POST calls return the two pieces this tutorial needs: the live board, then the daily series.
import json
import requests

API_URL = "https://api.trendsmcp.ai/api"
HEADERS = {
    "Authorization": "Bearer YOUR_API_KEY",
    "Content-Type": "application/json",
}


def call(payload):
    resp = requests.post(API_URL, headers=HEADERS, json=payload)
    resp.raise_for_status()
    envelope = resp.json()
    if envelope["statusCode"] != 200:
        raise RuntimeError(envelope["body"])
    return json.loads(envelope["body"])


board = call({"mode": "get_top_trends", "type": "Google News Top News", "limit": 10})
for rank, headline in board["data"]:
    print(rank, headline)

series = call({
    "mode": "get_time_series",
    "keyword": "black friday",
    "source": "Google News",
    "resolution": "daily",
})
peak = max(series, key=lambda p: p["value"])
print("peak:", peak["date"], peak["value"])
print("latest:", series[-1]["date"], series[-1]["value"])
print("points:", len(series))
The board call returns 10 rows. The series call returns 92 points. Each call costs 1 request over REST, so the whole script costs 2 requests. The board snapshot below was taken November 7, 2026 at 09:01 UTC. Output, first 3 board rows, then the series summary:
1 Stephen Miller's promotion angers industries reeling from immigration enforcement - The Washington Post
2 Why it's still too early to call the US Senate race in Mississippi - AP News
3 Paraguay's President Santiago Pena impeached and arrested - BBC
...
peak: 2026-10-16 100
latest: 2026-11-06 25
points: 92
Rows 4 to 10 follow the same shape: a rank number, then a headline. The same script works for any other board by changing type, and for any other phrase by changing keyword. A curl version of the board call, for a terminal check before writing Python:
curl -X POST https://api.trendsmcp.ai/api \
  -H "Authorization: Bearer YOUR_API_KEY" \
  -H "Content-Type: application/json" \
  -d '{"mode": "get_top_trends", "type": "Google News Top News", "limit": 10}'
What each parameter controls
Type names a board; source names the data set behind one keyword. That split is the whole design. Get_top_trends takes type and no keyword: Google News Top News is one of 27 boards, and the call returns the current leaders on it. Get_time_series takes keyword and source: black friday on Google News is one phrase on one of 14 keyword sources, and the call returns its history as points. Type belongs to board calls and source belongs to series calls; each call takes its own parameters.
Limit sets how many board rows come back: 1 to 200, default 25. The tutorial asks for 10. Sort sets the board order: rank is the default, rank_change lists climbers instead. Window only applies with rank_change: 1d, 3d, 7d, 14d, or 30d, default 30d. It sets the span the climbers are measured against.
Resolution sets the shape of a series. Daily returns about 90 days of points, fetched live. The black friday pull holds 92 daily points from August 7 to November 6. Weekly is the default and covers about 5 years. Daily fits a recent spike. Weekly fits a long trend.
Country is optional on both calls. Boards default to US. Google time series default to worldwide. The full parameter list for every mode sits in the docs.
The response body is a JSON string, not parsed JSON
REST always answers HTTP 200 with an envelope, so the payload sits inside body as a string. The code above reads statusCode first, then parses body a second time with json.loads. That second parse is the step most first scripts skip. Board rows arrive as pairs of rank and headline; with sort rank_change they arrive as objects carrying prev_rank and rank_change instead. Series points arrive as objects with date, value, keyword, and source, plus volume where the source has it. Errors arrive in the same envelope with a status code and a message. The parse step is also covered on its own in parse the Trends API response body.
Black friday peaked on October 16, then ran flat
Black friday peaked at index 100 on October 16, then ran between 15 and 25 across the last 8 days. The series starts at index 6 on August 7, 2026. Only 3 days in the whole 92 point run reached 90 or above. The latest value, 25 on November 6, sits at one quarter of the peak, 21 days after it.
The 8 day average is 18.5. The only sharp move in that stretch is November 5, up 8 points from 17 to 25, and November 6 holds at 25. The daily values:
- October 30: 15
- October 31: 15
- November 1: 18
- November 2: 17
- November 3: 16
- November 4: 17
- November 5: 25
- November 6: 25
Nothing in the last 8 days comes close to the October 16 peak. The series ends November 6, so later movement is not in this pull. A daily pull ends near today, since daily resolution reaches back only about 90 days. For the longer view, switch resolution to weekly and read the same keyword over about 5 years. The Google News board shows the same top stories without code.
Two mistakes break most first calls
Most first calls fail for one of two reasons: a missing key header, or a body read as parsed JSON. The header mistake fails authentication: the key never arrived, was typed wrong, or was replaced since. The fix is one line, exactly Authorization: Bearer YOUR_API_KEY, sent on every call. Keys are free to create and need no credit card; the pricing page carries the limits for each tier.
The body mistake raises a KeyError on the first run. Calling resp.json() returns the envelope, not the data, so reading data straight off it fails. The parse step in the section above turns body from a string into the board object or the points list. Both mistakes surface fast: the first call either returns the board or names the error in plain text.
Where to go next
The docs page carries the full parameter list for every mode, including get_growth for point to point change over windows such as 3M and 12M. The time series reference covers the series options in detail: country, language on Wikipedia, and the resolution choices. From here, the natural next script swaps the keyword: one phrase per call, one series per phrase, then the same peak and latest printout. Keep each call to one keyword and one source, and the costs stay at 1 request per call.