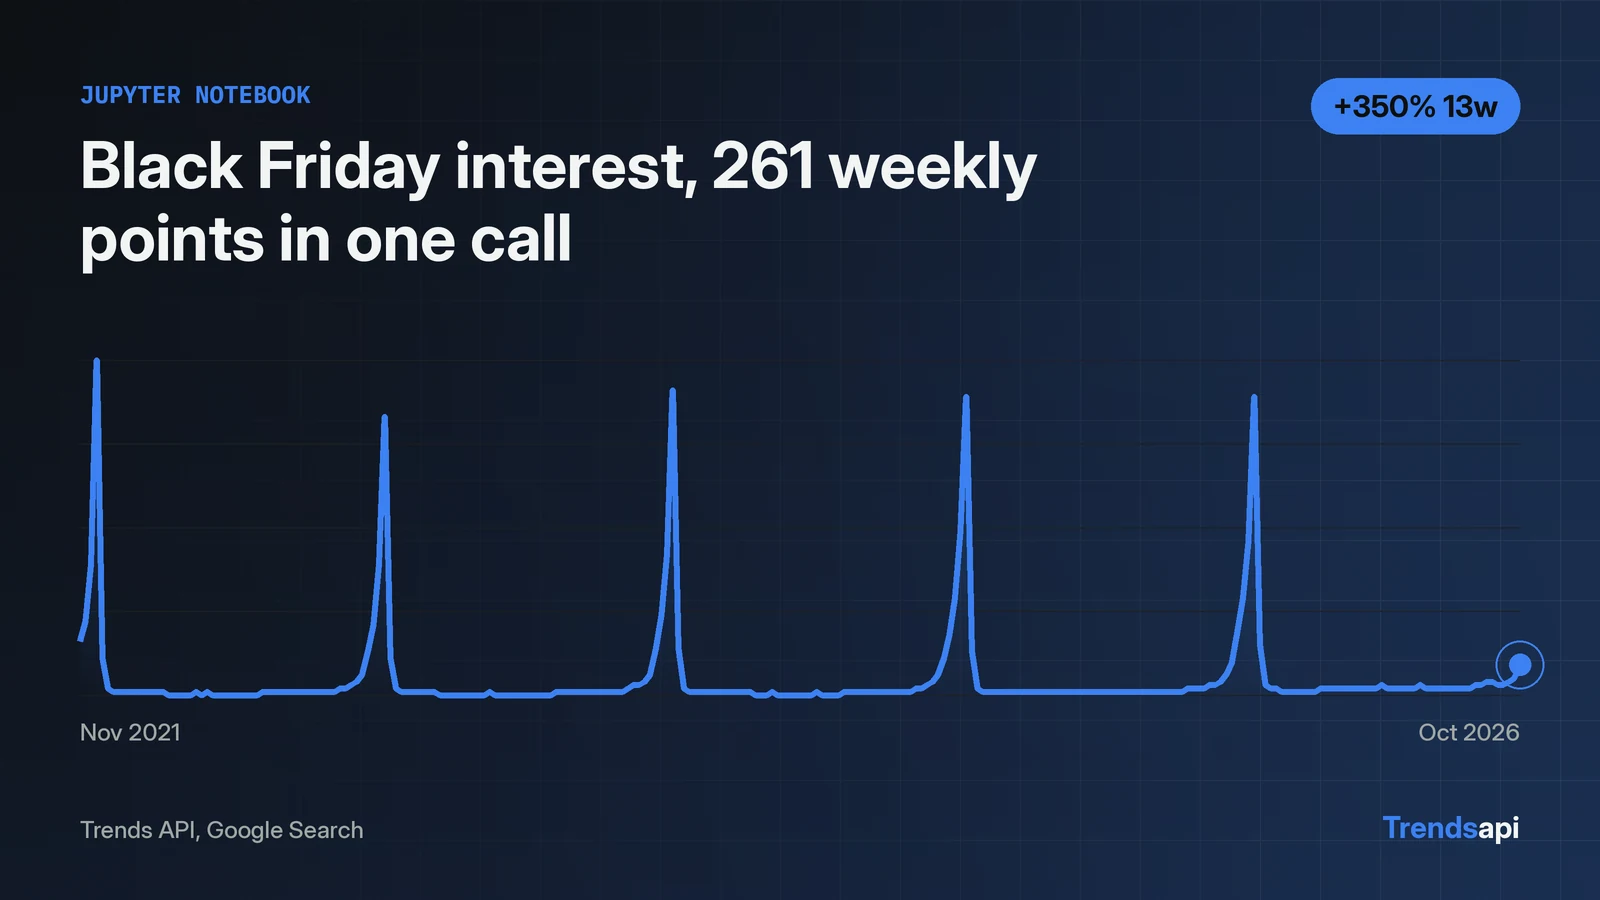
A Jupyter notebook gives a short loop for testing the Trends API against Google Search: one cell sends the request, the next cell holds the data as a DataFrame. This tutorial runs the whole loop against the live API with the keyword "black friday" on the Google Search source, not Google's own Trends API: the calls below go to the Trends API endpoint shown in the code. The call returns 261 weekly points, from 6 November 2021 to 31 October 2026, and the last point reads 9 on the 0 to 100 index, up 200% in a month as of 8 November 2026. The code below ran as written on that date, and the outputs shown are the real outputs. A free API key comes from the account page; request limits are on /pricing.
Three libraries cover the whole loop
One cell installs the libraries. Run it once per environment.
%pip install requests pandas matplotlib
The key never belongs in a notebook file. getpass prompts for it at run time and keeps it out of the saved notebook.
import getpass

KEY = getpass.getpass("Trends API key: ")
Send the first call from a notebook cell
Every call is a POST to one endpoint with a JSON body. The body names the mode, the keyword and the source.
import json
import requests

resp = requests.post(
    "https://api.trendsmcp.ai/api",
    headers={
        "Authorization": "Bearer " + KEY,
        "Content-Type": "application/json",
    },
    json={
        "mode": "get_time_series",
        "keyword": "black friday",
        "source": "google search",
    },
    timeout=30,
)
if resp.status_code != 200:
    print(resp.status_code, resp.text)
    raise SystemExit("request failed")
envelope = resp.json()
if envelope.get("statusCode") != 200:
    print(envelope)
    raise SystemExit("request failed")
Two details decide whether this cell works. First, the header needs the literal word Bearer, a space, then the key. Second, failures arrive in two forms, and the cell handles both. Auth failures arrive as plain HTTP errors: a missing key returns HTTP 401 with {"error": "missing_api_key", "message": "Missing API key. Send it in the Authorization header."}, and a wrong key returns HTTP 403 with {"error": "invalid_api_key", "message": "Invalid API key."}, both confirmed in this run. Other failures arrive as HTTP 200 with a 400 inside the envelope, as the invalid-source case at the end of this tutorial shows. That is why the cell checks the status code explicitly instead of calling raise_for_status(): the explicit check prints the status and body before stopping. The body field holds JSON as a string, so parse it a second time: parse the HTTP response first, then parse the body string. One parse leaves a string, not a list, and pd.DataFrame on a string fails.
print(sorted(envelope.keys()))
print(envelope["statusCode"])
The output for the live call reads:
['body', 'statusCode']
200
The parsed list becomes a DataFrame in three lines
The next cell turns the parsed list into a DataFrame. Dates parse to timestamps, and the date becomes the index.
import pandas as pd

payload = json.loads(envelope["body"])
print(len(payload))
print(payload[0])
print(payload[-1])

df = pd.DataFrame(payload)
df["date"] = pd.to_datetime(df["date"])
df = df.set_index("date").sort_index()
The live output for "black friday" reads:
261
{'date': '2021-11-06 00:00:00+00:00', 'value': 16.0, 'keyword': 'black friday', 'source': 'google search'}
{'date': '2026-10-31 00:00:00+00:00', 'value': 9.0, 'keyword': 'black friday', 'source': 'google search'}
The payload is a list of 261 dicts with four fields: date, value, keyword, source. After set_index, the frame has three columns and a date index. Weekly points run oldest first in the payload, so sort_index after setting the date index keeps the order explicit rather than assumed. The pandas guide covers the same load step for other sources.
The head and tail show whether the series is what was asked for
Print the head and the tail. The head shows the series start; the tail shows the current level.
print(df.head(3).to_string())
print(df.tail(3).to_string())
The live output reads:
                           value       keyword         source
date
2021-11-06 00:00:00+00:00   16.0  black friday  google search
2021-11-13 00:00:00+00:00   22.0  black friday  google search
2021-11-20 00:00:00+00:00   39.0  black friday  google search
                           value       keyword         source
date
2026-10-17 00:00:00+00:00    4.0  black friday  google search
2026-10-24 00:00:00+00:00    5.0  black friday  google search
2026-10-31 00:00:00+00:00    9.0  black friday  google search
The tail tells the story at a glance: 4, then 5, then 9 across the last three weeks of October 2026. The head shows the series opening at 16 on 6 November 2021, 20 days before Black Friday that year, on 26 November 2021. Checking both ends catches the two common surprises: a series that starts later than expected, and a latest point that lags the calendar by a week. The latest point here is 31 October 2026, eight days before the data date.
Growth comes from the frame, and get_growth confirms it
Weekly points make growth arithmetic simple: the latest row against the row four or thirteen weeks back. One month back is five rows, because the latest point counts as row one, and the baseline sits 28 days back.
recent = df["value"].iloc[-1]
month_ago = df["value"].iloc[-5]
quarter_ago = df["value"].iloc[-14]

print("1M:", round((recent - month_ago) / month_ago * 100, 1))
print("3M:", round((recent - quarter_ago) / quarter_ago * 100, 1))
The live output reads:
1M: 200.0
3M: 350.0
The same numbers come back from the get_growth mode, which is the cross check. This is the cell that produced them, sent in the same session:
growth_resp = requests.post(
    "https://api.trendsmcp.ai/api",
    headers={
        "Authorization": "Bearer " + KEY,
        "Content-Type": "application/json",
    },
    json={
        "mode": "get_growth",
        "keyword": "black friday",
        "source": "google search",
        "percent_growth": ["1M", "3M", "12M"],
    },
    timeout=30,
)
if growth_resp.status_code != 200:
    print(growth_resp.status_code, growth_resp.text)
    raise SystemExit("request failed")
growth_envelope = growth_resp.json()
if growth_envelope.get("statusCode") != 200:
    print(growth_envelope)
    raise SystemExit("request failed")
growth = json.loads(growth_envelope["body"])
print(growth["results"])
The live output reads:
[{'status': 'success', 'recent_date': '2026-10-31 00:00:00+00:00', 'recent_value': 9.0, 'baseline_date': '2026-10-03 00:00:00+00:00', 'baseline_value': 3.0, 'growth': 200.0, 'growth_unit': 'percent', 'direction': 'increase', 'calculation_method': 'point_to_point', 'period': '1M'}, {'status': 'success', 'recent_date': '2026-10-31 00:00:00+00:00', 'recent_value': 9.0, 'baseline_date': '2026-08-01 00:00:00+00:00', 'baseline_value': 2.0, 'growth': 350.0, 'growth_unit': 'percent', 'direction': 'increase', 'calculation_method': 'point_to_point', 'period': '3M'}, {'status': 'success', 'recent_date': '2026-10-31 00:00:00+00:00', 'recent_value': 9.0, 'baseline_date': '2025-11-01 00:00:00+00:00', 'baseline_value': 10.0, 'growth': -10.0, 'growth_unit': 'percent', 'direction': 'decrease', 'calculation_method': 'point_to_point', 'period': '12M'}]
It returned 200.0% for 1M (9 against 3 on 3 October 2026), 350.0% for 3M (9 against 2 on 1 August 2026, 91 days back), and -10.0% for 12M (9 against 10 on 1 November 2025). The 12M dip needs its context: it compares 31 October 2026 with 1 November 2025, and the baseline sits before the November 2025 peak, so it compares late October with early November. The growth endpoint reference lists every window preset.
Plot the last 52 weekly points
A plot of the full span, 6 November 2021 to 31 October 2026, compresses the recent ramp into a flat line. Slice the last 52 weekly points first.
import matplotlib.pyplot as plt

last_52 = df.tail(52)
last_52["value"].plot(title="Black Friday search interest, last 52 weeks")
plt.xlabel("Week")
plt.ylabel("Index, 0 to 100")
plt.show()
The window runs 8 November 2025 to 31 October 2026, and its shape is the reverse of what a first guess suggests. The highest point, 89 on 29 November 2025, sits near the start of the window, in the Black Friday week of last year. After that comes a long flat stretch through most of 2026, then a small rise to 9 at the end. The current reading of 9 sits about one tenth of that peak, and the series ends on 31 October 2026, before the 2026 event on 27 November 2026.
Four failures to watch for
A missing key returns HTTP 401 and a wrong key returns HTTP 403, with the error bodies shown in the first call cell. Both were confirmed with live calls in this run, and both arrive as plain error bodies, which is why the cell above checks the status code before parsing. The third failure is the parse: pd.DataFrame(resp.json()["body"]) fails, because the body is still a string and pandas raises ValueError on a plain string. The fix is the two-step parse in the first call cell: parse the envelope, then parse the body.
One more check before reusing this notebook for another keyword: confirm the source name. The data catalog lists the exact source names. Source names are case insensitive: a call sent with "GOOGLE SEARCH" in this run returned HTTP 200 with the same first row as "google search". A wrong source name returns HTTP 200 with an envelope statusCode of 400 and an error body naming the bad source, "'not a source' is not a valid source.", plus a valid_sources list.