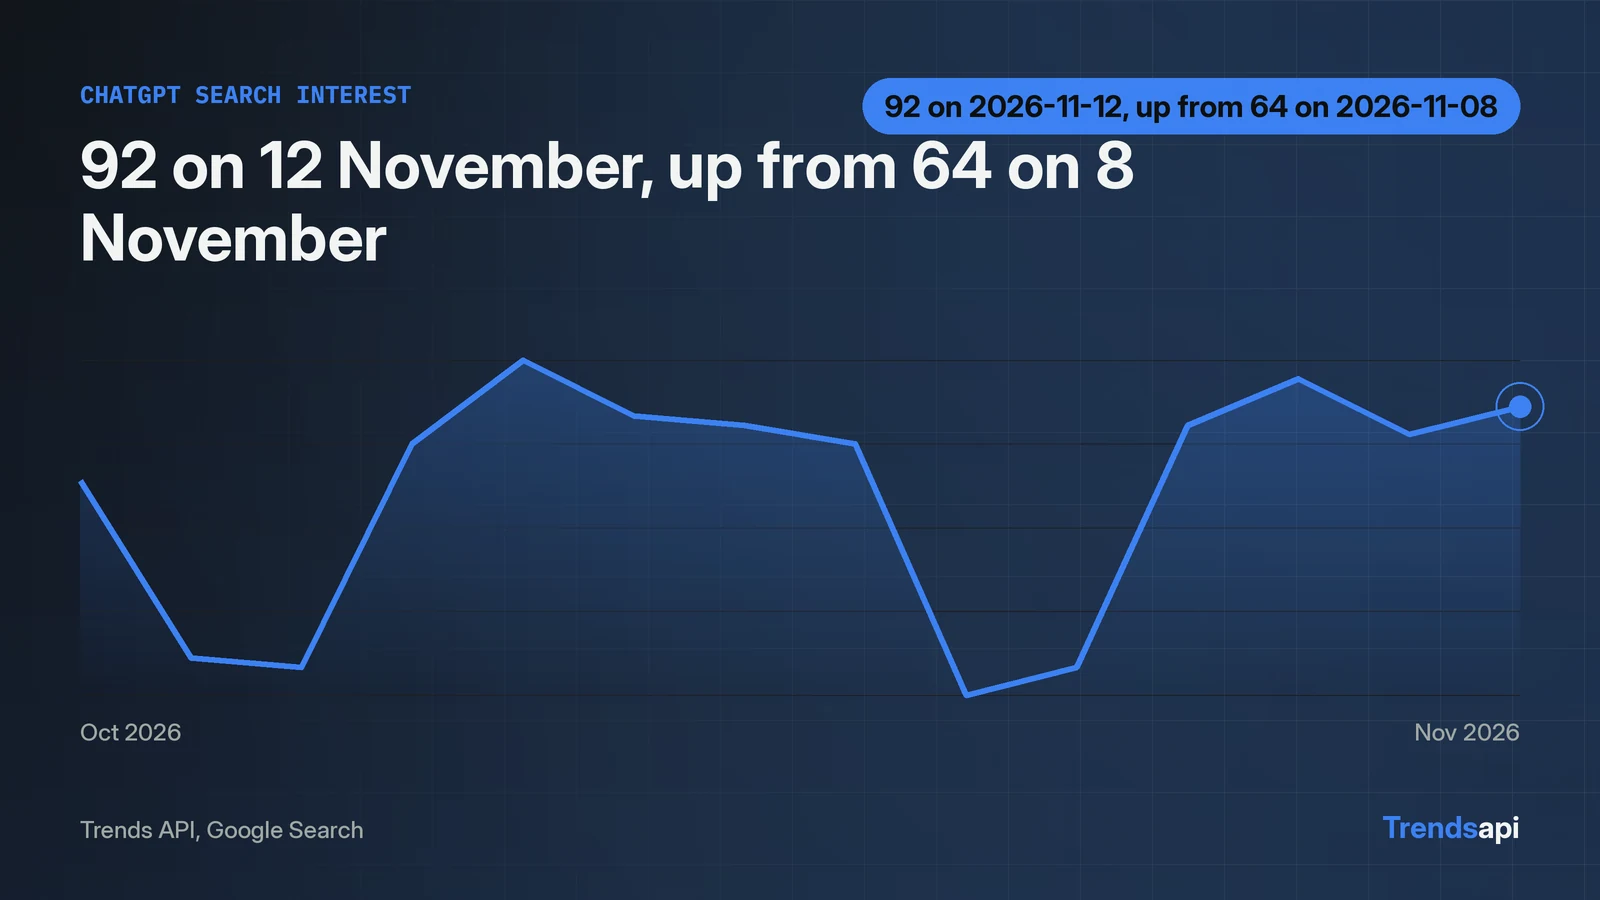
There is no realtime Google Trends endpoint. The Trends API exposes six modes, and none of them streams live search interest. The closest working setup pairs two calls. A daily resolution get_time_series call returns about 90 days, and a live check on 2026-11-13 showed the latest point was yesterday, 2026-11-12, with ChatGPT at 92 on a 0 to 100 index. A get_top_trends board call returns the freshest ranked list, but its snapshot age depends on the feed: the Google Trends board was 9 days old at the same check, while the X board was about 1 hour old. The tutorial below gives working Python for both calls, a freshness check to run before trusting any board, and a polling schedule that matches what the data can deliver.
No realtime endpoint exists in the API
The API exposes six modes, and a realtime mode is not one of them. The mode list in the API reference is get_time_series, get_growth, get_top_trends, get_context, get_top_posts, and get_usage. Each mode answers a different question, and none of them opens a stream or a websocket.
get_time_series returns history for one keyword on one source. get_growth returns point-to-point change over windows such as 7D or 3M. get_top_trends returns a ranked board as of its latest snapshot. get_context returns what people are posting and reading about a keyword right now. get_top_posts returns live top posts for one hashtag. get_usage reports plan use.
That list sets the shape of every realtime design on this API. A developer who wants "what is hot right now" reaches for get_top_trends. A developer who wants "how fast is this rising" reaches for get_time_series with daily resolution, or get_growth. Nothing in the reference offers a push feed, a poll interval under a minute, or a parameter named realtime.
The search demand behind the question is thin. Google Ads Keyword Planner showed no reportable monthly volume for "google trends realtime api" and none for "realtime trends api" in the check run on 2026-11-13, so demand sits below the reporting floor rather than at a literal zero. The readers who do ask the question are usually building a dashboard or an alert, and they need the honest answer first: the API gives near-realtime data, not live ticks.
The freshest series data ends yesterday
A daily resolution series for ChatGPT on Google Search ran 92 points from 2026-08-13 to 2026-11-12, so the newest point lags the check by one day. The call ran at 10:07 UTC on 2026-11-13. The last five points were 64 on 8 November, 90 on 9 November, 95 on 10 November, 89 on 11 November, and 92 on 12 November. The peak across the whole 92 day window was 100 on 2026-09-09.
| Date | ChatGPT search interest (0 to 100) |
|---|---|
| 2026-11-08 | 64 |
| 2026-11-09 | 90 |
| 2026-11-10 | 95 |
| 2026-11-11 | 89 |
| 2026-11-12 | 92 |
Two details in that table matter for code. First, the weekend dip is real and repeats: 61 on Saturday 7 November and 64 on Sunday 8 November, against 88 to 97 on the weekdays around them. A series that only looks at the last point will read a Monday jump as a spike. Second, the values are a 0 to 100 index, not absolute search counts. This call returned no volume field, so code that needs absolute numbers must pick a source that carries volume or use the index as a relative signal.
Daily resolution covers about 90 days and is fetched live, per the API reference. Weekly resolution is the default and returns about five years, close to 260 points per call. For a realtime dashboard, daily is the right choice: it is the shortest window the series endpoint offers, and it is the only resolution that moves day to day.
import requests

resp = requests.post(
    "https://api.trendsmcp.ai/api",
    headers={
        "Authorization": "Bearer YOUR_API_KEY",
        "Content-Type": "application/json",
    },
    json={
        "mode": "get_time_series",
        "keyword": "chatgpt",
        "source": "Google Search",
        "resolution": "daily",
    },
    timeout=30,
)
resp.raise_for_status()
points = resp.json()
latest = points[-1]
print(latest["date"], latest["value"])  # 2026-11-12 92
The points arrive sorted by date from earliest to latest, which puts the newest day at the end of the array. The last element is the freshest point. Code that reads points[-1] gets yesterday. Code that assumes the last point is today will be wrong by a day, every day.
Board freshness depends on the feed, not the API
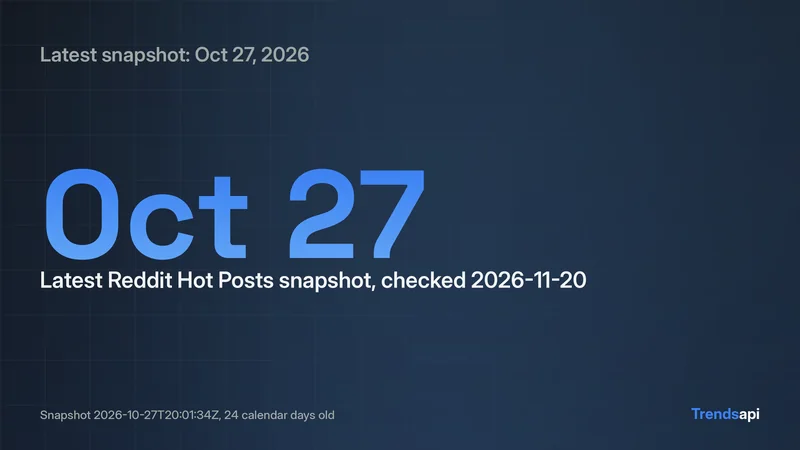
The Google Trends board snapshot was 9 days old on 2026-11-13, while the X board snapshot was about 1 hour old, so freshness is a property of the feed. Both boards came from the same get_top_trends mode, one request each, seconds apart. The only difference was the feed behind the board.
| Board | Snapshot (as_of_ts) |
Lag at check | Top term | Rows |
|---|---|---|---|---|
| Google Trends | 2026-11-04T07:01:36Z | 9 days 3 hours | 2026 us election results |
10 |
| X (Twitter) Trending | 2026-11-13T09:01:38Z | about 1 hour 6 minutes | Giants | 5 |
The Google Trends board told on itself. Its top 10 on 13 November still led with election terms from 4 November: 2026 us election results, "michigan senate race", "ohio election results", and "where to vote". A board that fresh would not lead with a nine day old election. The snapshot date explains the list, and the list confirms the snapshot date.
Every board response carries as_of_ts, the timestamp of the snapshot. That field is the freshness check. Read it on every call, compare it with the current time, and decide in code whether the board is fresh enough for the use case. A dashboard that prints board rows without printing as_of_ts will show stale data as if it were live, and nobody reading the page will know.
from datetime import datetime, timezone

board = requests.post(
    "https://api.trendsmcp.ai/api",
    headers={
        "Authorization": "Bearer YOUR_API_KEY",
        "Content-Type": "application/json",
    },
    json={"mode": "get_top_trends", "type": "Google Trends", "limit": 10},
    timeout=30,
).json()

snapshot = datetime.fromisoformat(board["as_of_ts"])
age_hours = (datetime.now(timezone.utc) - snapshot).total_seconds() / 3600
print(f"Board age: {age_hours:.1f} hours")
if age_hours > 24:
    print("Stale board: show the snapshot date next to the rows.")
The working setup: daily series plus a board check
Two calls cover the realtime use case: a daily series for the trend line, and a board call with an as_of_ts check for what is moving now. Neither call alone is enough. The series gives shape over 90 days but says nothing about today. The board gives today, or claims to, but only the snapshot timestamp says whether to believe it.
A minimal poller runs the series call once a day and the board call once an hour. It stores both responses, and it stores the as_of_ts next to the board rows. The page then shows three things: the series chart ending yesterday, the board rows, and the board age in hours. That third number is what keeps the page honest.
import json
import requests

API_URL = "https://api.trendsmcp.ai/api"
HEADERS = {
    "Authorization": "Bearer YOUR_API_KEY",
    "Content-Type": "application/json",
}

def call_api(payload):
    resp = requests.post(API_URL, headers=HEADERS, json=payload, timeout=30)
    resp.raise_for_status()
    return resp.json()

series = call_api({
    "mode": "get_time_series",
    "keyword": "chatgpt",
    "source": "Google Search",
    "resolution": "daily",
})
board = call_api({
    "mode": "get_top_trends",
    "type": "Google Trends",
    "limit": 10,
})
Clients that wrap the REST call, including MCP clients, often return the response body as a JSON string, so parse it again with json.loads before reading fields. The requests code above returns parsed JSON directly, which is the simpler path for a Python service.
Each call costs 1 request on REST. See /pricing for the plan that fits the polling rate. A once a day series call plus an hourly board call is 25 requests a day for one keyword and one board.
Poll on a schedule the data can keep
Polling every minute wastes requests, because the underlying data moves once a day for series and once per snapshot for boards. The daily series gains a new point once a day. Polling it hourly returns the same 92 points 23 times. Polling it every minute returns the same points 1,439 times.
A schedule that matches the data looks like this: run the series call once a day, after 00:00 UTC, and keep the result until the next run. Run the board call once an hour, and skip the run when the last as_of_ts has not changed. Cache both responses on disk or in a small store, and serve the page from the cache. The page stays fast, the request count stays low, and the numbers on the page stay as fresh as the source allows.
The board needs one more guard. When as_of_ts stops moving, the feed has stalled. The Google Trends board in this tutorial sat at 4 November for nine days. A poller that only checks for new rows would keep serving those rows as current. A poller that checks as_of_ts can flag the stall, show the snapshot date on the page, and switch the "moving now" slot to a fresher board, such as X, until the Google feed moves again.
What to use when daily is not fast enough
When a dashboard needs movement inside the day, get_context and get_growth answer different questions faster than re-polling a series. get_context returns posts, videos, stories, and comments about a keyword from each source, with engagement, which shows what people are saying right now rather than how search interest moved yesterday. get_growth returns point-to-point change over windows as short as 7D, which turns the daily series into a single rising or falling number.
Neither mode is a live tick. get_context shows fresh posts, not a live count. get_growth compares two points, and the newest point is still yesterday. The honest framing for a reader is that the API answers "what moved" and "what are people saying" close to live, while the search interest number itself updates daily. A dashboard that labels the series "live" overstates it. A dashboard that labels it "daily, updated 2026-11-12" tells the truth, and the reader can judge the number for what it is.
For the parameter list of each mode, including country and category options, see the /docs pages and the Python tutorial for the Google Trends API. The trending now API page covers board calls in more depth, and the time series API page covers series options.
FAQ
Does the Trends API have a realtime or streaming endpoint?
No. The six modes are get_time_series, get_growth, get_top_trends, get_context, get_top_posts, and get_usage. The closest working setup is a daily resolution series, which ends yesterday, plus a board call with an as_of_ts freshness check.
How fresh is the Google Trends board?
It varies by feed and by day. On 2026-11-13 the Google Trends board snapshot was 9 days old, dated 2026-11-04T07:01:36Z, while the X board snapshot was about 1 hour old. Read as_of_ts on every board call and print the age next to the rows.