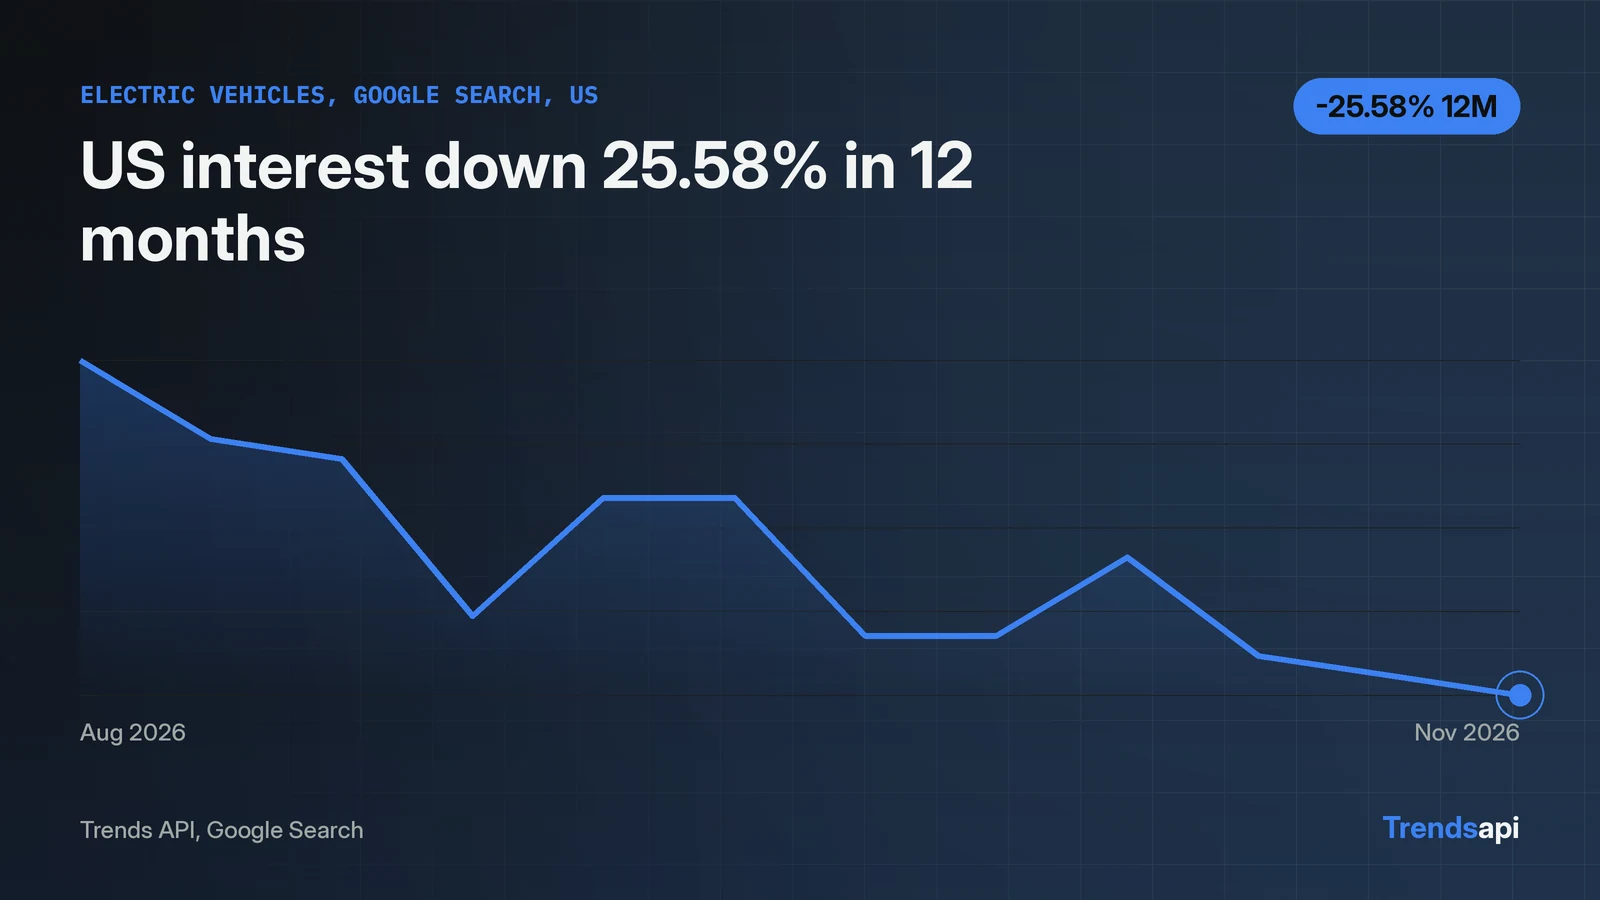
Region-level trend data from the Trends API stops at the country. There is no state, province or city breakdown, and a region parameter is silently ignored. In this run, US-CA, US-TX and the nonsense code XX-ZZ all returned byte-identical data to the worldwide series. The working route is the country option on get_time_series and get_growth. One keyword, electric vehicles, on Google Search returned 261 weekly points for the US, GB and worldwide, each ending 2026-11-07. Over 12 months the US fell 25.58 percent, GB fell 38.78 percent and worldwide fell 47.62 percent. The code below pulls all three series in one script and prints the comparison.
There is no state or city split
The API documents five options: country, language, resolution, category and comments. region is not one of them. Passing it does not raise an error. It returns the worldwide series as if the field were absent.
Three calls proved it on 2026-11-13, all for electric vehicles on Google Search. region set to US-CA, region set to US-TX and region set to XX-ZZ each returned 261 weekly points, first point 2021-11-13 at value 30.0 with volume 535,714, last point 2026-11-07 at value 22.0 with volume 392,857. All three outputs were byte-identical to the call with no country at all. A made-up code returning real data suggests the field is dropped before the query runs.
Country is the finest grain the API offers. A dashboard that needs California against Texas has to use another source for the split, then use this API for the country series around it.
The working call adds one field: country
Adding country turns the worldwide series into a country series. One REST request does it: POST https://api.trendsmcp.ai/api with an Authorization: Bearer YOUR_KEY header and a JSON body. mode names the tool to run. The reply carries HTTP 200 even when the job failed, so inspect statusCode before touching anything else. The response body arrives as a JSON string. Parse it a second time and the result is the list of points.
import json
import requests

resp = requests.post(
    "https://api.trendsmcp.ai/api",
    headers={"Authorization": "Bearer YOUR_KEY"},
    json={
        "mode": "get_time_series",
        "keyword": "electric vehicles",
        "source": "Google Search",
        "country": "US",
    },
)
envelope = resp.json()
if envelope["statusCode"] != 200:
    raise SystemExit(envelope["body"])
payload = json.loads(envelope["body"])
print(payload[0])
print(payload[-1])
The live output for the US call on 2026-11-13:
{"date": "2021-11-13", "value": 59, "keyword": "electric vehicles", "source": "google search", "volume": 1676136}
{"date": "2026-11-07", "value": 32, "keyword": "electric vehicles", "source": "google search", "volume": 909091}
Each point carries a date, a 0 to 100 index value, the keyword, and the source. Volume appears when the source reports it. Leave country out and the same call returns the worldwide series instead. The value is an index, not a share of searches, so the US figure of 32 and the GB figure of 30 do not mean the two countries searched at nearly the same rate.
country takes an ISO 3166-1 alpha-2 code. US and GB were tested in this run; the API reference also lists JP. It works on the Google sources, Search, Images, News and Shopping, plus YouTube, TikTok and Pinterest for series and growth calls. The get_time_series reference lists the full option set for this call.
One script pulls the US, GB and worldwide series
The same call with three country values gives a region comparison in one loop. The script below pulls the US, GB and worldwide series for electric vehicles and prints the last point of each.
import json
import requests

def series(country):
    body = {
        "mode": "get_time_series",
        "keyword": "electric vehicles",
        "source": "Google Search",
    }
    if country:
        body["country"] = country
    resp = requests.post(
        "https://api.trendsmcp.ai/api",
        headers={"Authorization": "Bearer YOUR_KEY"},
        json=body,
    )
    envelope = resp.json()
    if envelope["statusCode"] != 200:
        raise SystemExit(envelope["body"])
    return json.loads(envelope["body"])

for label, code in [("US", "US"), ("GB", "GB"), ("Worldwide", None)]:
    points = series(code)
    print(label, len(points), "points,", points[-1]["date"],
          "value", points[-1]["value"], "volume", points[-1]["volume"])
The run on 2026-11-13 returned 261 weekly points per series, from 2021-11-13 to 2026-11-07. The table below pairs each last point with the same date a year earlier, 2025-11-08, taken from the same series.
| Region | 2025-11-08 value | 2025-11-08 volume | 2026-11-07 value | 2026-11-07 volume | 12-month change |
|---|---|---|---|---|---|
| US | 43 | 1,221,591 | 32 | 909,091 | -25.58% |
| GB | 49 | 924,528 | 30 | 566,038 | -38.78% |
| Worldwide | 42.0 | 750,000 | 22.0 | 392,857 | -47.62% |
All three regions fell over the year, but the US fell least. The worldwide drop is steeper than either the US or the GB drop, which suggests the fall outside those two countries was sharper still.
Growth calls confirm the series, with one caveat on volume
get_growth returns the same comparison without fetching 261 points per country. One call per country, with percent_growth set to ["12M"], gave the same values as the series above. Window presets such as 3M and 12M are listed in the growth windows reference.
resp = requests.post(
    "https://api.trendsmcp.ai/api",
    headers={"Authorization": "Bearer YOUR_KEY"},
    json={
        "mode": "get_growth",
        "keyword": "electric vehicles",
        "source": "Google Search",
        "country": "US",
        "percent_growth": ["12M"],
    },
)
envelope = resp.json()
if envelope["statusCode"] != 200:
    raise SystemExit(envelope["body"])
print(json.loads(envelope["body"])["results"][0])
The live US result on 2026-11-13:
{"status": "success", "recent_date": "2026-11-07", "recent_value": 32.0,
 "baseline_date": "2025-11-08", "baseline_value": 43.0, "growth": -25.58,
 "growth_unit": "percent", "direction": "decrease",
 "calculation_method": "point_to_point", "period": "12M",
 "recent_volume": 909000.0, "baseline_volume": 1220000.0,
 "volume_growth": null,
 "volume_growth_omitted_reason": "volume is derived from the trend value for this source, not an independent measurement"}
The GB call returned -38.78 percent (49.0 to 30.0) and the worldwide call returned -47.62 percent (42.0 to 22.0), matching the series table exactly. The growth volumes are rounded to the nearest thousand, so the US figure of 909,000 here is the same point the series table shows as 909,091. volume_growth came back null on all three calls. The API says volume for Google Search is derived from the trend value, not measured on its own. Treat volume as scale for the index, not as a second independent count, and compute growth from the index values.
Boards work by country too, but check the row count
get_top_trends takes the same country option on the boards that support it, including Google Trends. The US board with limit 5 returned five rows as of 2026-11-04T07:01:36Z.
| Rank | Topic |
|---|---|
| 1 | 2026 US election results |
| 2 | james talarico |
| 3 | michigan senate race |
| 4 | gina hinojosa |
| 5 | native american heritage month |
Boards default to US when no country is passed.
The GB board did not behave the same way. Two calls on 2026-11-13, with limit 5 and limit 10, both returned count 0, an empty data list and as_of_ts null. The calls succeeded and still cost a request each. A board can come back empty without an error, so code that reads a board should check count before trusting the rows, and fall back to the series calls when a board is empty.
Index values cannot be compared across countries
Each country series is treated as scaled 0 to 100 on its own. That is the working assumption behind this piece, so compare growth rates and volumes across countries, never the raw index values. Volume on Google Search is derived from the index, so it shows scale, not a separate count. The series in this run covered about five years at weekly steps, 261 points from 2021-11-13 to 2026-11-07, so a 12-month window has enough history behind it.
Keyword demand for this exact question is thin. Google Ads Keyword Planner returned a volume of 0 for both "trends api region data" and "google trends region data" on 2026-11-13, which means too little to report rather than zero searches. The working alternative is above: swap the keyword and country codes in the script, run it for the countries the dashboard needs, and check the request limits on pricing before running it at scale.