A seasonality detector answers one question about a keyword: does it peak in the same weeks every year, and did anything break the pattern? This tutorial builds one in Python with the Trends API, using only the standard library plus requests. It pulls five years of weekly Google Search interest, finds the peak week of each year, works out the peak month, and flags any week outside the season that rose above half the year's peak. Two keywords test it: Halloween costume, which behaves, and Christmas decor, which does not.
The client: one function, one endpoint
Every call goes to POST https://api.trendsapi.ai/api with a JSON body naming the mode. The key goes in the Authorization header as Bearer <key>. The free key needs only an email address: type the 8-digit code that arrives, and the key is ready, with 100 requests a month and no card. The response arrives as an envelope, so read statusCode first, then parse the body, which is itself a JSON string. Most first attempts miss that second parse.
import json
import requests

API = "https://api.trendsapi.ai/api"
KEY = "YOUR_API_KEY"  # free tier: 100 requests a month


def get_series(keyword, source="Google Search"):
    resp = requests.post(
        API,
        headers={"Authorization": f"Bearer {KEY}"},
        json={"mode": "get_time_series", "keyword": keyword, "source": source},
        timeout=30,
    )
    resp.raise_for_status()
    envelope = resp.json()
    if envelope.get("statusCode") != 200:
        raise RuntimeError(envelope)
    return json.loads(envelope["body"])  # body is a JSON string: parse it again
One call returns about 260 weekly points, oldest first, each with a date and a value on a 0 to 100 index. One request per source is charged, so a single-keyword pull costs one request. The rest of the detector is plain Python on that list.
Peak week per year, then the peak month
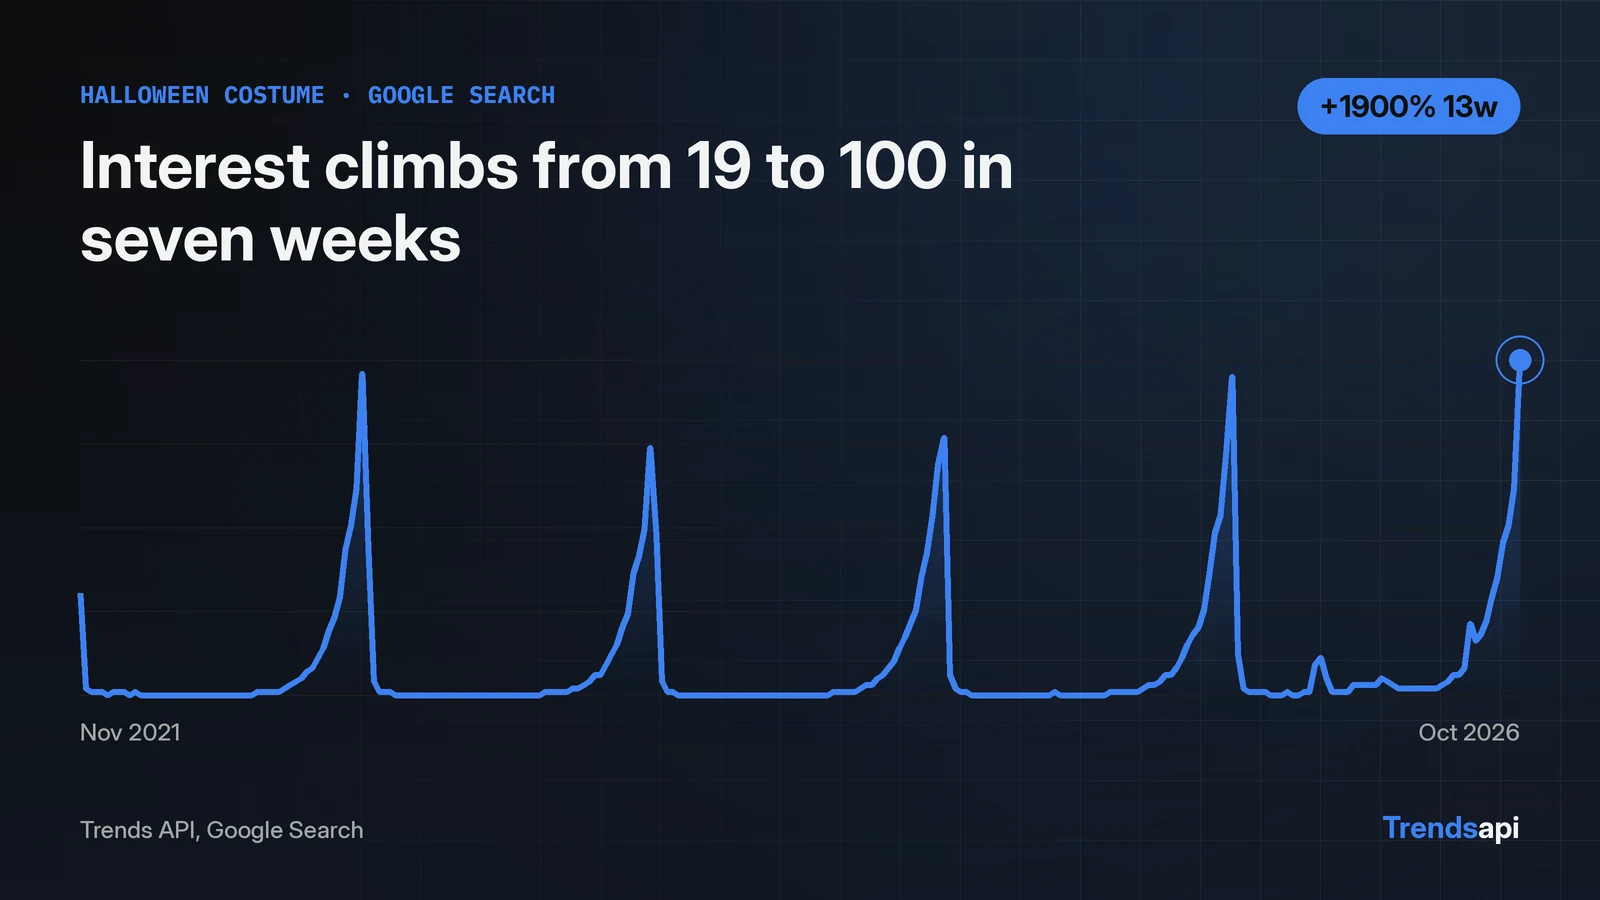
For Halloween costume the peaks land in late October or early November every year, and the peak month is October. Group the points by calendar year, take the maximum in each year, and count which month those peaks fall in. The peak month is the mode of the peak months, and the season is that month plus one month either side. One guard matters: skip any year with fewer than 10 weeks of data, or a stub year like 2021, which starts in November, would crown a November week as its peak and tilt the count.
from collections import Counter, defaultdict


def yearly_peaks(points):
    by_year = defaultdict(list)
    for p in points:
        by_year[p["date"][:4]].append(p)
    peaks = {}
    for year, pts in sorted(by_year.items()):
        if len(pts) < 10:
            continue  # stub year: a few weeks cannot crown a peak
        peaks[year] = max(pts, key=lambda p: p["value"])
    return peaks


def peak_month(peaks):
    months = Counter(p["date"][5:7] for p in peaks.values())
    return months.most_common(1)[0][0]
Run on "halloween costume", the peaks land on October 29, 2022 (96), October 28, 2023 (74), November 2, 2024 (77), November 1, 2025 (95), and October 31, 2026 (100). Five peaks, five late-October to early-November weeks, and the peak month is October. The climb into the 2026 peak is steep and steady: 19 on September 12, 23, 30, 36, 46, 51, 62, then 100 on October 31. Interest more than quintupled in seven weeks, and the detector reads that as a clean seasonal ramp, not a surprise.
Flag the weeks that break the pattern
Halloween costume returns no flags, and the rule that produces that silence is simple: any week outside the season whose value tops half the year's peak gets reported. Half the peak is the bar because a seasonal keyword still hums outside its season, and the detector should only shout about real breaks.
def off_season_spikes(points, peaks, peak_month):
    season = {f"{(int(peak_month) + d - 1) % 12 + 1:02d}" for d in (-1, 0, 1)}
    flags = []
    for year, peak in peaks.items():
        bar = peak["value"] / 2
        for p in points:
            if p["date"][:4] != year:
                continue
            if p["date"][5:7] not in season and p["value"] > bar:
                flags.append((p["date"][:10], p["value"], year))
    return flags, season
Halloween costume returns no flags. The highest week outside September to November in the whole five years is August 29, 2026, at 22, far below the bar of 50. That silence is a result: the keyword is seasonal, and the detector can say so with a number instead of a feeling.
The second keyword breaks it on purpose
Christmas decor runs the same code and trips the flag twice. Its December peaks are regular: 71 in 2021 (December 4), 60 in 2022 (December 3), 62 in 2023 (December 2), 66 in 2024 (December 7), and 82 in 2025 (December 6). The peak month is December, the season is November to January, and the 2026 season is already climbing: 28 on October 31, then 57 on November 7, more than double in a week.
Then the flag fires. In February 2026, interest hit 74 on February 14 and 100 on February 21, then 47 on February 28 and 8 by March 7. The week of February 21 is the five-year maximum for the keyword, higher than any December peak, and it sits one month past the end of the November to January season. The series gives no cause for it, and the detector does not invent one. It reports the dates and values, and the reader decides whether a February spike in Christmas decor is a data quirk, a viral moment, or a buying event worth chasing. A detector that only confirms the obvious is a calendar; the flag is what makes it a tool.
Run it on your own keyword
The same three functions sort any keyword into seasonal, spiky, or flat. Swap the keyword, keep the rest. The call costs one request per source, so a free tier covers a hundred keywords a month. Two cautions from the runs above. First, the index is relative: 100 is the highest week in the five-year window, so a single freak week rescales every other value. Christmas decor's December peaks look modest next to the February spike only because February set the scale. Second, check the last date in the series before trusting a recent value. The Halloween series ends October 31, 2026, and the Christmas decor series ends November 7, so treat the last week as possibly incomplete, and re-pull before acting on a recent value.
The full script is the four blocks above, about 60 lines. It returns yearly peaks, a peak month, and a list of off-season spikes, which is enough to sort a keyword list into seasonal, spiky, and flat before spending a dollar on content or stock. The first-calls tutorial covers the other modes the same client can reach, and the charting guide turns a series like this one into a chart.
if __name__ == "__main__":
    for keyword in ["halloween costume", "christmas decor"]:
        points = get_series(keyword)
        peaks = yearly_peaks(points)
        month = peak_month(peaks)
        flags, season = off_season_spikes(points, peaks, month)
        print(keyword, "peaks:", {y: (p["date"][:10], p["value"]) for y, p in peaks.items()})
        print(keyword, "peak month:", month, "season:", sorted(season))
        print(keyword, "off-season spikes:", flags)