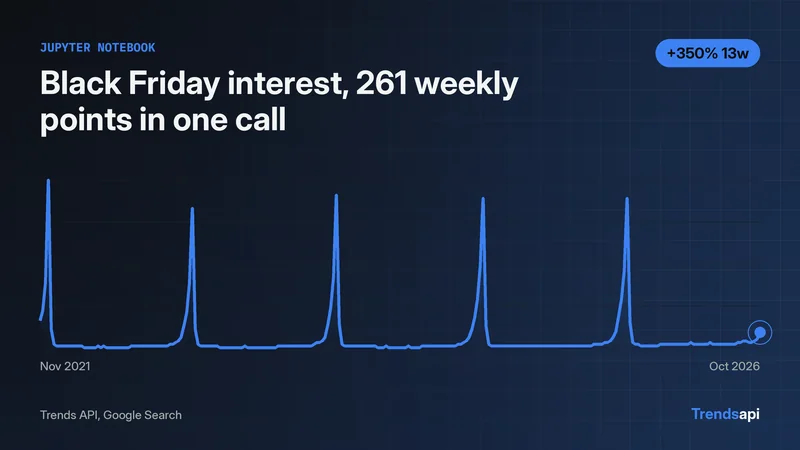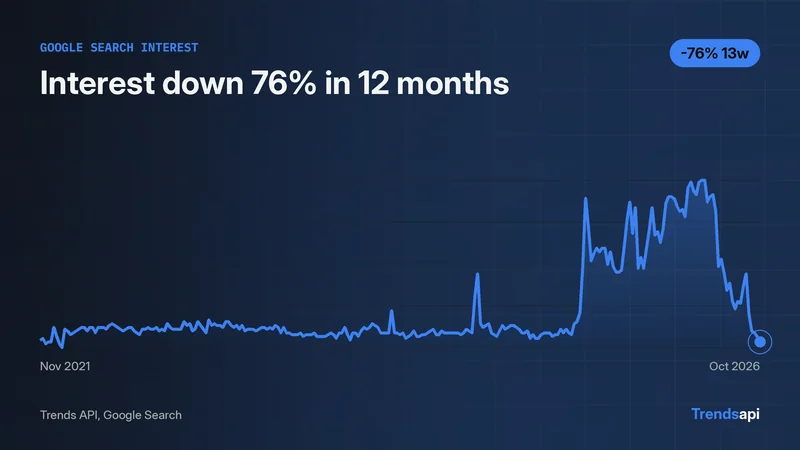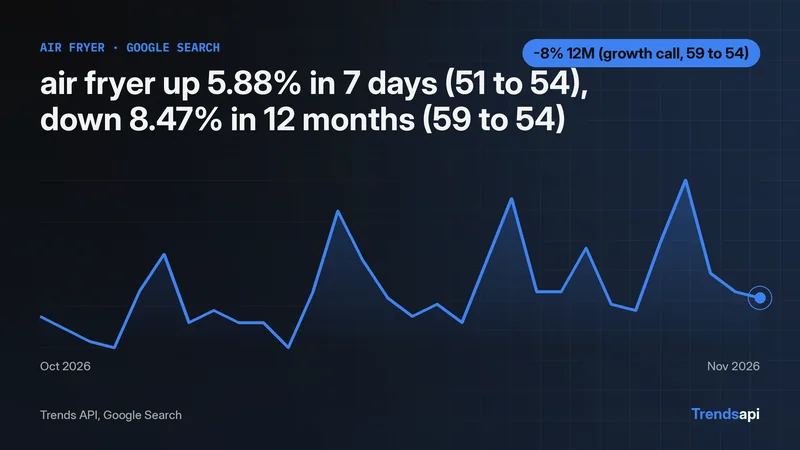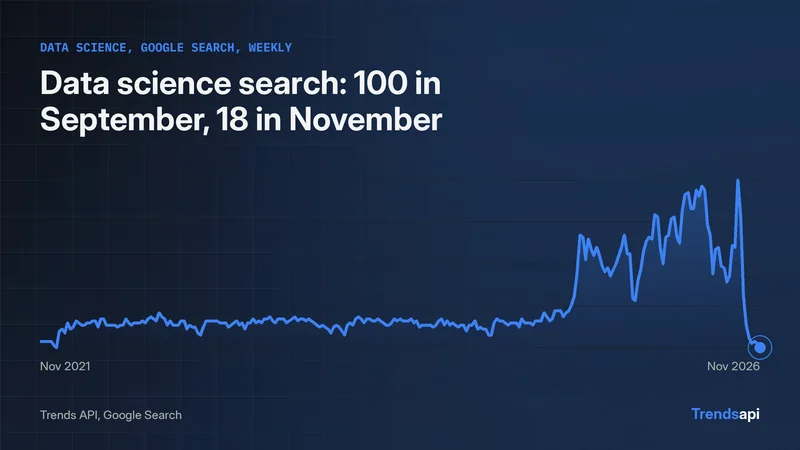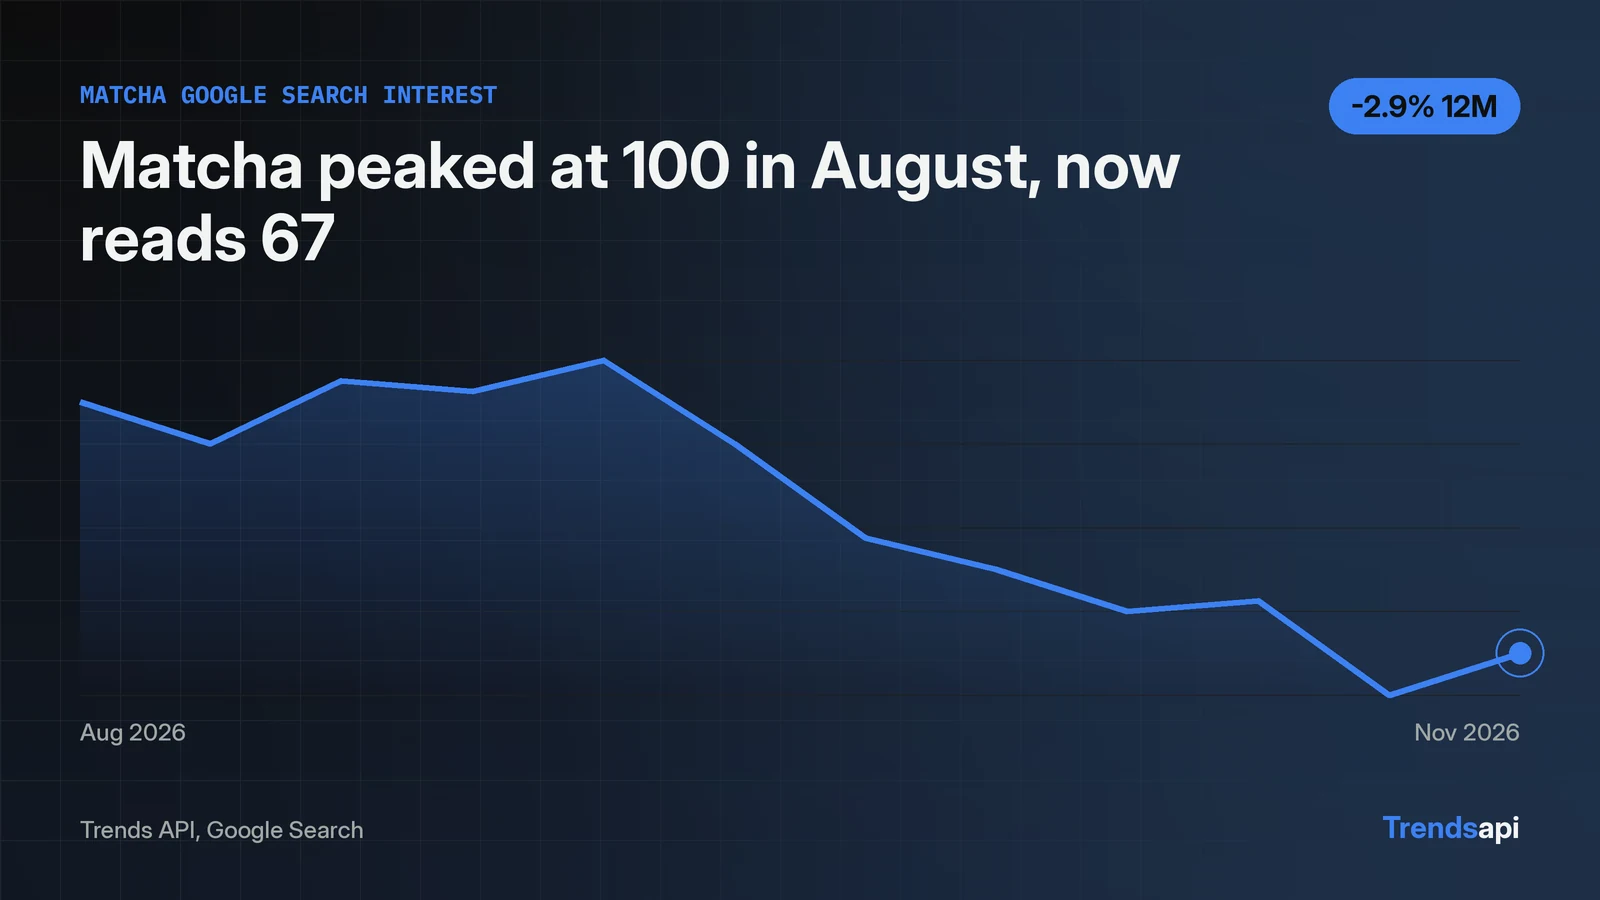
The whole tutorial runs on one endpoint. A POST to https://api.trendsmcp.ai/api with a JSON body carries every call, and the key travels in the Authorization header as Bearer <key>. This page builds a short client around that call, then uses it six ways: a full history for "matcha", growth over three windows, a comparison with "green tea", one call across two sources, the live Google Trends board, and YouTube context. The live calls ran on 2026-11-10. Matcha returned 261 weekly points from 2021-11-13 to 2026-11-07, peaked at 100 on 2026-08-08, and read 67 on the last point. Request limits live on /pricing.
A short client carries every call in the tutorial
One helper function serves all four modes. It posts the JSON body, checks the envelope, and hands back a list. Nothing else in the tutorial posts directly; every call goes through this helper.
import json, os
import requests

KEY = os.environ["TRENDS_API_KEY"]
URL = "https://api.trendsmcp.ai/api"

def call(body):
    resp = requests.post(URL, headers={
        "Authorization": f"Bearer {KEY}",
        "Content-Type": "application/json",
    }, json=body, timeout=30)
    resp.raise_for_status()
    envelope = resp.json()
    if envelope.get("statusCode") != 200:
        raise SystemExit(envelope)
    parsed = envelope["body"]
    return json.loads(parsed) if isinstance(parsed, str) else parsed
One quirk decides whether this helper works: the envelope's body arrives as a JSON string, so the code decodes the string after decoding the HTTP response. Reading envelope["body"] as a finished list returns a string, not data. The last line falls back to a direct return when the body is already parsed. The notebook tutorial shows the same call inside a notebook; the Google Search reference covers the envelope shape in full.
Pull 261 weekly points for one keyword
get_time_series returns the full history for one keyword on one source. About five years of weekly points arrive as a 0 to 100 index.
series = call({
    "mode": "get_time_series",
    "keyword": "matcha",
    "source": "Google Search",
})
print(len(series), series[0], series[-1])
The live call returned 261 points. The first reads 18 on 2021-11-13. The last reads 67 on 2026-11-07. The peak sits at 100 on 2026-08-08. Each point carries date, value, keyword and source. The response carried no volume figure for this keyword. The twelve most recent points show the slide from the August peak: 91, 87, 93, 92, 95, 87, 78, 75, 71, 72, 63, then 67.
Growth answers faster than a chart
get_growth compares two points directly, so no chart is needed to answer "how fast is this moving". One call can carry several windows at once.
growth = call({
    "mode": "get_growth",
    "keyword": "matcha",
    "source": "Google Search",
    "percent_growth": ["1M", "3M", "12M"],
})
for row in growth["results"]:
    print(row["period"], row["growth"], row["recent_value"], row["baseline_value"])
The three windows tell three different stories. One month: down 10.67 percent, from 75 to 67. Three months: down 33 percent, from the 100 peak to 67. Twelve months: down 2.9 percent, from 69 to 67. The short window looks like a fall. The twelve-month window says matcha interest sits almost exactly where it sat a year ago. A single window would have misled in either direction.
Two comparisons, one mode
The same mode takes several sources in one call. One call with source "Google Search, YouTube" returned both 12-month results for matcha: Google Search down 2.9 percent, YouTube up 37.5 percent, from 40 to 55. The same keyword moved in opposite directions on the two sources. A single-source read would have missed half the story.
The same mode also compares two keywords. "Green tea" is the obvious foil for matcha.
multi = call({
    "mode": "get_growth",
    "keyword": "matcha",
    "source": "Google Search, YouTube",
    "percent_growth": ["12M"],
})
green_tea = call({
    "mode": "get_growth",
    "keyword": "green tea",
    "source": "Google Search",
    "percent_growth": ["12M"],
})
| Keyword | 12-month change | Recent value | Year-ago value |
|---|---|---|---|
| matcha | -2.9% | 67 | 69 |
| green tea | -31.48% | 37 | 54 |
Matcha held its level while green tea fell by nearly a third. The green tea call also returned estimated volumes: 314,000 recent searches against 459,000 a year earlier. Matcha returned no volume, so the comparison rests on the index alone.
Read what is moving right now
get_top_trends needs no keyword. It returns a live ranked board, either the current leaders or the biggest climbers.
board = call({"mode": "get_top_trends", "type": "Google Trends", "limit": 5})
print(board["as_of_ts"], board["data"])
The call returned five rows from the snapshot taken 2026-11-04. The top row was "2026 US election results". The next four were "james talarico", "michigan senate race", "gina hinojosa" and "native american heritage month". The snapshot date matters. This board last refreshed on November 4, six days before this run, so the rows describe that day, not today. Always read as_of_ts before quoting a board. Asking for the biggest climbers instead returned no rows in this run: the board had turned over completely against the 7-day baseline, so no rank change could be computed. The note in the response says to use sort rank for the current board.
Add context: what people actually post
get_context pulls what people are posting, reading and watching about a keyword right now, with engagement attached. One source per call on REST.
context = call({"mode": "get_context", "keyword": "matcha", "source": "YouTube"})
print(context["count"])
print(context["sources"][0]["items"][0]["title"])
The YouTube call returned 10 items from the last 7 days. The top video, "PERSIMMON MATCHA?? not sure about this one. #matcha #matcharecipes #willitmatcha #kitchenhacks", posted 2026-11-04 by Hannah Sophia, carried 1,119,389 views, 45,332 likes and 554 comments. Not every source answers every time. The same call against Reddit in this run returned 0 items with a "source unavailable" note, and the code should treat an empty items list as a normal result, not an error.
Two failures confirmed, one more from the contract
Two of these were confirmed in this run. The third comes from the response contract, as documented on the Google Search reference, not from a live failure.
try:
    series = call({"mode": "get_time_series", "keyword": "matcha", "source": "Google Search"})
except requests.HTTPError as err:
    print(err.response.status_code, err.response.text[:200])
A missing key returns HTTP 401 with {"error": "missing_api_key"}. A wrong key returns HTTP 403 with {"error": "invalid_api_key"}. Both were confirmed by sending the request without a key and with a made-up key. No call in this run hit a rate limit. Query failures arrive the other way, per the response contract: HTTP 200 with the envelope's statusCode set to something else, and the reason in the body. No call in this run produced one. Auth failures arrive as plain HTTP errors; query failures arrive inside the envelope. The Wikipedia tutorial shows the same error handling against a different source.
Daily points: 92 days in this run
Weekly points are the default, and they suit a five-year view. A resolution of daily returns daily points instead, fetched live. The reference lists the option for the Google sources and YouTube.
daily = call({
    "mode": "get_time_series",
    "keyword": "matcha",
    "source": "Google Search",
    "resolution": "daily",
})
print(len(daily), daily[0]["date"], daily[-1]["date"])
The live call returned 92 daily points from 2026-08-10 to 2026-11-09. Daily resolution fits a different question: what happened over the last 92 days, not over five years. A weekly point covers seven days in one number. A spike that lasts two days reads smaller in that number than it did day by day. The two resolutions answer different questions, and switching between them costs one extra call.
Save the series and the work is reusable
The client above is the whole toolkit. Wrap it in a script, save the series to CSV, and the same calls run for the next keyword.
import csv

with open("matcha.csv", "w", newline="") as f:
    writer = csv.DictWriter(f, fieldnames=["date", "value", "keyword", "source"])
    writer.writeheader()
    writer.writerows(series)
Twelve calls covered this tutorial: nine data calls and three probes. Swap the keyword and the same nine data calls run again.