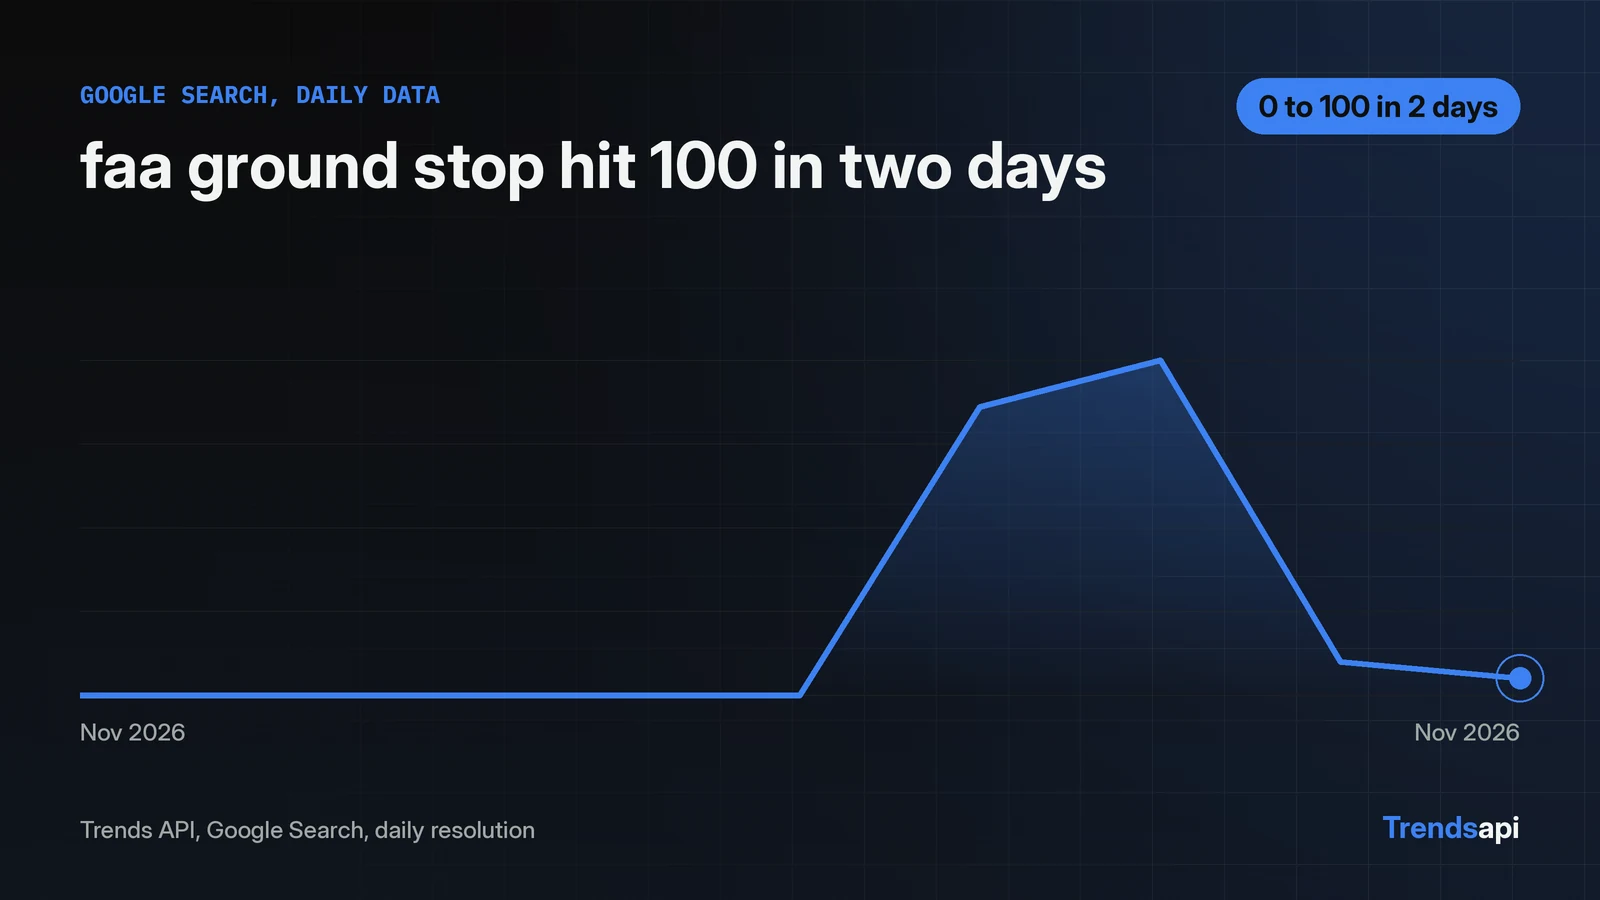
A trend spike alert polls the Trends API once a day for each term on a watchlist, then fires when daily search interest jumps past a threshold. The rule in this piece: alert when today's value reaches 50 or higher on the 0 to 100 index and sits at least 40 points above the 7-day median. Tested on Nov 17, 2026, the rule fired on three real spikes from the same week. faa ground stop read 0 on Nov 8 to 12, 86 on Nov 13, and 100 on Nov 14. Outlook outage hit 100 on Nov 13, and microsoft outage did the same. A quiet control term, electric vehicles, stayed between 9 and 23 in that same window and fired nothing. The full script is about 45 lines of Python with requests, and three terms polled daily cost 90 requests in 30 days.
The alert fires on a jump, not on a level
A spike alert needs two conditions: a high value and a big move from the baseline. One condition alone misfires. Two hypothetical rules show why. A level-only rule, value above 50, would ring all month for any popular term. A jump-only rule, up 40 points in a day, would ring for a quiet term that moved from 2 to 45. The pair filters both cases.
The rule used here: fire when today's value is 50 or higher and at least 40 points above the 7-day median. On Nov 13, faa ground stop read 86 against a median of 0, a jump of 86, so the alert fired. On Nov 15 it read 10, so it stayed quiet.
The control term shows the other side. Electric vehicles read 23 on Nov 11 against a 7-day median of 10, a jump of 13, far short of 40. No alert fired in its Nov 10 to 16 window, where values ran 10, 23, 9, 11, 9, 9, 9.
The loop replays history, so a missed day still alerts
The loop below polls each term once a day and replays the full returned series, so a spike from days ago still fires its alert on the next run. A run on Nov 17 prints the Nov 12 to 14 firings even though the latest values, Nov 16, are quiet.
import json
import os
import statistics

import requests

API_URL = "https://api.trendsmcp.ai/api"
API_KEY = os.environ["TRENDS_API_KEY"]
WATCHLIST = ["faa ground stop", "outlook outage", "microsoft outage"]
MIN_VALUE = 50
MIN_JUMP = 40

def fetch_daily(keyword):
    resp = requests.post(
        API_URL,
        headers={"Authorization": f"Bearer {API_KEY}"},
        json={"mode": "get_time_series", "keyword": keyword,
              "source": "Google Search", "resolution": "daily"},
        timeout=30,
    )
    resp.raise_for_status()
    envelope = resp.json()
    if envelope.get("statusCode", 200) != 200:
        raise RuntimeError(envelope.get("body", "Trends API error"))
    return json.loads(envelope["body"])

def check(keyword):
    points = fetch_daily(keyword)
    for i in range(7, len(points)):
        today = points[i]
        prior = [p["value"] for p in points[i-7:i]]
        baseline = statistics.median(prior)
        if today["value"] >= MIN_VALUE and today["value"] - baseline >= MIN_JUMP:
            send_alert(keyword, today, baseline)

def send_alert(keyword, today, baseline):
    message = (f"SPIKE: {keyword} hit {today['value']} on {today['date']} "
               f"(7-day median {baseline:.0f})")
    print(message)
    webhook = os.environ.get("ALERT_WEBHOOK_URL")
    if webhook:
        requests.post(webhook, json={"text": message}, timeout=10)

for term in WATCHLIST:
    check(term)
Each poll sends one POST with mode get_time_series, source Google Search, and resolution daily. Daily resolution is what catches a two-day spike; the weekly series ended Nov 7 and saw nothing. The reply wraps its payload in an outer object, and the body value inside is JSON text rather than a parsed object, so run json.loads on it once more. The loop tests each day in the returned series instead of only the latest point, which is why a run on Nov 17 still prints the Nov 12 to 14 firings. The alert goes to print and, when ALERT_WEBHOOK_URL is set, to a webhook. Swap that line for email or a chat post; the threshold logic stays the same.
The docs cover setup and authentication, and the first-calls tutorial walks through the same request shape step by step. The Google Trends API Python page covers the same endpoint for readers starting from scratch. Each get_time_series call costs 1 request. Three terms polled once a day cost 90 requests in 30 days. The pricing page carries the request pools.
Three terms spiked between Nov 12 and 14
Three terms on the watchlist spiked between Nov 12 and 14, 2026, and all three peaked at 100. The daily series for each term ran 92 points, Aug 17 to Nov 16.
| Term | First spike day | Peak | Day after peak |
|---|---|---|---|
| faa ground stop | Nov 13, 86 | 100 on Nov 14 | 10 on Nov 15 |
| outlook outage | Nov 12, 81 | 100 on Nov 13 | 5 on Nov 14 |
| microsoft outage | Nov 12, 53 | 100 on Nov 13 | 9 on Nov 14 |
The shapes differ in one detail. faa ground stop rose over two days, 0 on Nov 12, 86 on Nov 13, 100 on Nov 14, then fell to 10 on Nov 15. Outlook outage rose in one day, 0 to 81 on Nov 12, peaked at 100 on Nov 13, then fell to 5 on Nov 14. Microsoft outage did the same: 0 to 53 on Nov 12, 100 on Nov 13, 9 on Nov 14.
A run of the loop on Nov 17 prints six lines, one per firing, and nothing for Nov 16, when the three terms read 5, 2 and 3:
SPIKE: faa ground stop hit 86 on 2026-11-13 (7-day median 0)
SPIKE: faa ground stop hit 100 on 2026-11-14 (7-day median 0)
SPIKE: outlook outage hit 81 on 2026-11-12 (7-day median 0)
SPIKE: outlook outage hit 100 on 2026-11-13 (7-day median 0)
SPIKE: microsoft outage hit 53 on 2026-11-12 (7-day median 0)
SPIKE: microsoft outage hit 100 on 2026-11-13 (7-day median 0)
Before the spike, faa ground stop read 0 in 87 of its 92 daily points. Outlook outage and microsoft outage each read 0 in 85 of 92.
The board agreed with the series. The Google Trends board pulled Nov 17 at 11:01 UTC ranked faa ground stop first, outlook outage second, and microsoft outage third.
News coverage gives the reason for the faa ground stop spike. A Nov 13 NBC News story, grouped with 5 outlets and 6 articles, reported thousands of flights canceled or delayed after the FAA issued a nationwide ground stop. The shape suggests a search echo of that day, not a slow build.
Weekly growth missed all three spikes
The weekly growth call reported 0.0 percent for the 7, 14 and 30 day windows on faa ground stop, while the daily series showed a peak of 100 in the same week. The weekly series ended Nov 7, six days before the Nov 13 spike. The call flagged the data itself: quality low, with a warning that the signal is over 90 percent zero values.
Treat weekly growth as a tool for slow builds over months, not for two-day events. Alerts need the daily series. A reasonable use remains: run it once when a term joins the watchlist, to learn whether the baseline drifts upward over months. Do not use it to catch the spike.
The threshold comes from the baseline, not from a guess
The threshold that worked here came from the baseline: the three spiking terms read 0 in 85 to 87 of 92 daily points, so 50 stood far above noise. A term with a busy baseline needs a different number.
The code applies two conditions at once: value at 50 or higher, and value minus the 7-day median at 40 or higher. The effective level is the higher of the two, max(50, median plus 40). For a term whose median is 20, the jump condition sets the bar: 20 plus 40 is 60, so the alert fires at 60, not 50. For a term whose median is 0, the level condition sets the bar at 50.
Recheck the median each month. A term that grows into steady attention raises its own baseline. That last point is inference, not a measured result: no term in this piece grew that way, and a fixed threshold may start firing every day if the baseline climbs. The data catalog lists the other sources the same call shape works on.
What the alert cannot tell the reader
The alert says search interest jumped. It says nothing about why, how long the jump lasts, or whether anyone will still care next week. The why came from a separate call, get_context on News, which returned the Nov 13 ground stop coverage. Without that call, the spike is a number with no story.
The index is relative, too. A value of 100 means the peak of the period, not a count of searches, and the daily responses for these terms carried no volume field. Two terms can both read 100 with very different numbers of searches behind them. Treat one spike as a signal to look, not as a conclusion. A second spike a week later, or a rising baseline over a month, says more than a single day at 100.