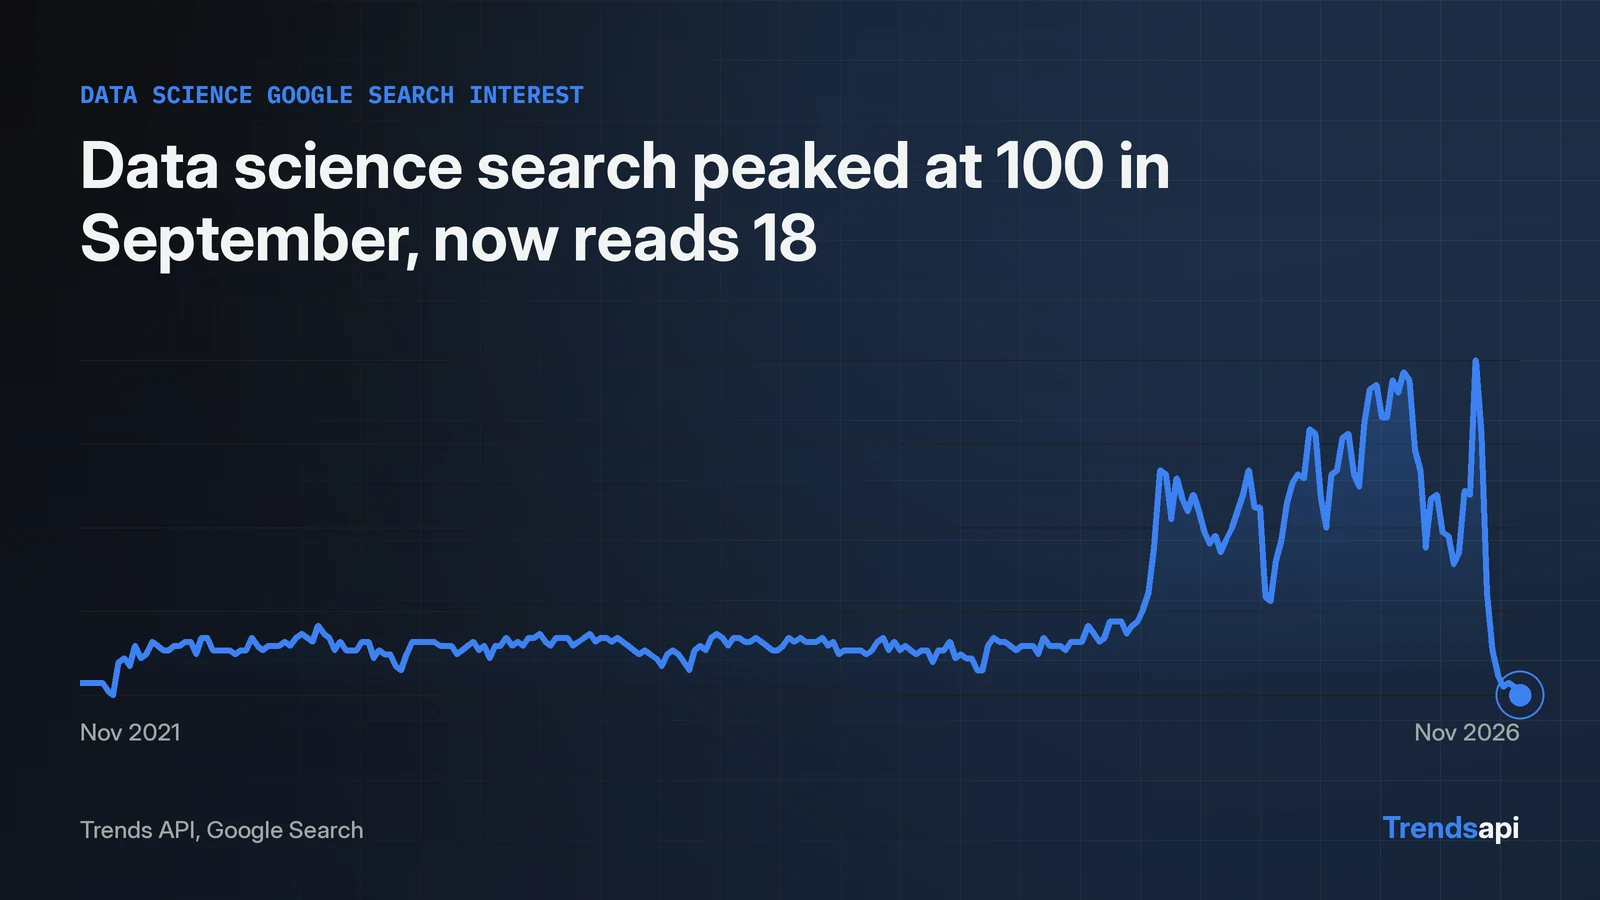
A search trends API turns "what are people searching for" into a call a program can make. This one takes a single POST to https://api.trendsmcp.ai/api, with mode naming the tool in the JSON body and the key in the Authorization header as Bearer <key>. A live call on November 16, 2026 for "data science" on Google Search returned 261 weekly points from November 20, 2021 to November 14, 2026, each one scored 0 to 100. The high point came in the week of September 19, 2026, at 100, then the series closed at 18 on November 14. The pricing page lists the request pools for each plan.
The request that works
One POST does the whole job. Five tools live behind that one address, and the mode field picks which one runs. The key on its own, without the Bearer prefix, also passes.
curl -X POST https://api.trendsmcp.ai/api \
  -H "Authorization: Bearer <your key>" \
  -H "Content-Type: application/json" \
  -d '{"mode": "get_time_series", "keyword": "data science", "source": "Google Search"}'
The reply comes back wrapped: an outer object with statusCode 200 and a body field that holds the rows as a JSON string. Open the wrapper, then open the body. A point holds a date, an index value, the keyword, and the source. The data science call also carried a volume field on each point, 2,474,265 at the September peak, which is the source reporting absolute volume where it has it. No key at all comes back HTTP 401 with error missing_api_key; a wrong key comes back HTTP 403 with error invalid_api_key. Both were probed live on November 16, 2026. The curl call above is the shortest working form; the Google Trends API tutorial shows the same call inside a Python script.
Five tools, one endpoint
Five tools share the endpoint, and the same five are available over MCP. Each call draws on the monthly pool, and failed calls are not charged. Costs below are as stated by the usage call on November 16, 2026.
| Tool | Returns | Cost |
|---|---|---|
get_time_series |
One keyword, one source, weekly rows for about five years | 1 per source |
get_growth |
Latest point measured against earlier ones, several windows at once | 1 per source |
get_top_trends |
Ranked board as of a snapshot, or climbers since an earlier one | 1 per 10 rows |
get_context |
Current posts and articles about a keyword | 1 per source |
get_reviews |
Reviews for an app or product on the App Store, Google Play, or Amazon | 1 per source |
The usage call is the sixth tool. It runs over MCP only, where the reference lists it as free; the same call over REST returns invalid_mode. Over MCP it reports how many requests the plan has used and how many are left, plus the reset date. Together the tools reach 53 sources, from search and video to social, shopping, and gaming.
What the live board looked like on November 4
get_top_trends with type Google Trends and limit 10 returned this board, stamped November 4, 2026 at 07:01 UTC. Seven of the ten terms are election terms. Rank 1 is the 2026 U.S. election results, and rank 6 is where to vote. The candidate names in the list are james talarico at rank 2, gina hinojosa at rank 4, and abdul el-sayed at rank 10. The race terms are michigan senate race at rank 3 and ohio election results at rank 7. The three terms with no election connection are native american heritage month at rank 5, florida plane crash at rank 8, and what time is it at rank 9.
The board is twelve days old at the time of writing, and that staleness is the point: a board answer is only as fresh as its snapshot, so read as_of_ts before quoting a rank. A board that looks live can quietly be almost two weeks old, and an election board ages fastest of all. The Google Trends API tutorial walks through the same call in a full script, and the Google Search Trends API page covers the Google Search source in depth.
What a series point carries
Each point in a series is a small record, not a bare number. The data science call returned a date, a value on the 0 to 100 index, the keyword, and the source on every row, plus a volume field where the source reports it. The first point, November 20, 2021, reads 21 with a volume of 519,596. The last point, November 14, 2026, reads 18 with a volume of 445,368. The peak point, September 19, 2026, reads 100 with a volume of 2,474,265. Two checks fall out of that shape. First, the index and the volume move together here. Where they diverge, the volume is the better guide to scale and the index to shape. Second, the volume field appears where the source reports it: this call carried it on every point, while the Google Search Trends API page found no volume field for its keyword on November 6. Code that needs volume should read it with a default and keep working when it is absent. That is why code should parse the body into rows before doing anything else with it.